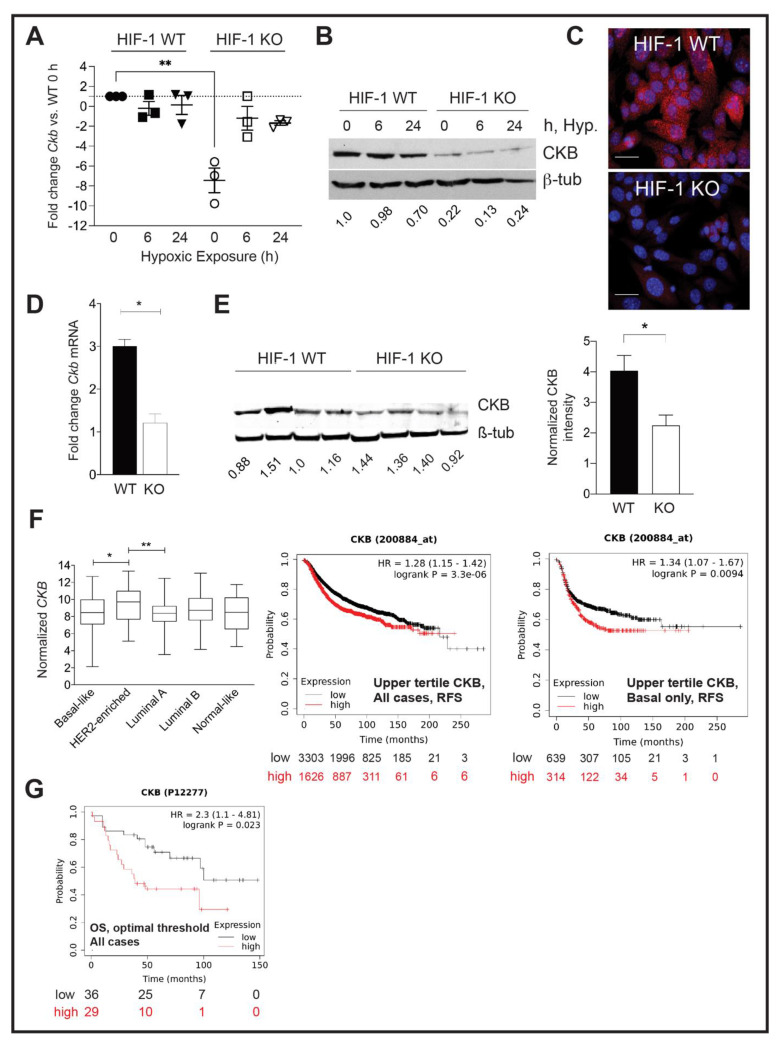
Figure 1.
CKB expression in HIF-1 WT and KO PyMT cells and in end-stage tumors, and correlation with prognosis in clinical datasets. (A) Scatter plot of the mean fold change ± SEM in Ckb mRNA levels relative to HIF-1 WT cells at normoxia (0h of hypoxic exposure). Each data point represents the mean of 3 technical replicates for an independent qPCR assay from a biological replicate experiment, and the overall mean of three biological replicates is shown. (B) PyMT cells were grown to 80% confluence and subjected to hypoxic culture for either 6 h or 24 h, or cells were continuously cultured at normoxia, such that the 0 h sample was harvested on the same day as the 24 h hypoxic sample. (A) Representative Western blot for CKB or β-tubulin (loading control) is shown. (C) Immunostaining for CKB (red) in HIF-1 WT and KO cells, counterstained with DAPI. Images were captured at 630× magnification (scale bar indicates 20 μm). (D) Ckb mRNA levels were compared in end-stage HIF-1 WT and KO tumors by qPCR. Data are expressed as the overall mean fold change ± SEM between WT and KO tumors; the KO sample was set to a fold change of 1.0 in each experiment. All data were first normalized for epithelial content based on Krt18 (n = 3 tumors/genotype/experiment). (E) Western blotting for CKB comparing four independent tumors per HIF genotype (each harvested at similar volumes). The top half of the blot was blotted for CKB, and the lower portion was blotted for β-tubulin. Blots were imaged on a LiCor Odyssey system and CKB expression was compared in HIF-1 WT versus KO tumors after normalization to β-tubulin. The bar graph shows the normalized CKB intensity ± SEM per genotype. (F) (Left) TCGA was queried for CKB mRNA expression levels among breast cancer subtypes, as defined by PAM50. Log2-normalized CKB expression is plotted, along with the 95% confidence interval and standard deviation. (Right) KM Plotter was used to plot the probability of RFS when patients were stratified by low (lowest-to-middle tertile) or high (upper tertile) expression of CKB mRNA levels (200884_at); plots are shown for either all breast cancer cases, or for basal breast cancer cases only. (G) OS is lower when CKB protein levels (P12277) are high (expression threshold optimized by KMPlotter). All images were directly exported from the KMPlotter tool.

