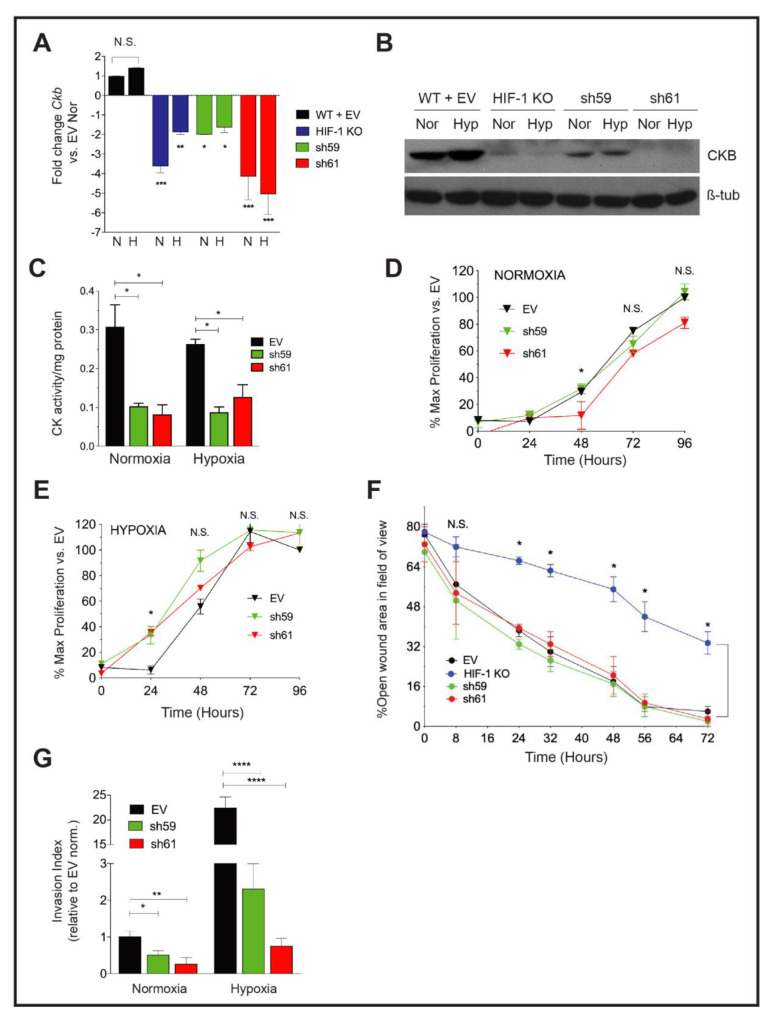
Figure 2.
Effect of Ckb knockdown in PyMT cells upon cell growth and invasion. (A) The mean fold change ± SEM in Ckb mRNA expression levels in HIF-1 KO cells and in shRNA KD pools (sh59 or sh61) relative to empty vector (WT +EV) cells as measured by qPCR. Cells expressing the sh61 shRNA showed the greatest reduction in Ckb mRNA levels. (B) PyMT cells were grown to 80% confluence and subjected to normoxic or hypoxia culture for 6 h and immunoblotted for CKB or β-tubulin (loading control). Changes in CKB protein are consistent with changes observed by qPCR, with sh61 KD cells showing the greatest reduction in CKB expression. (C) CKact was measured in whole cell extracts prepared from PyMT EV, sh59 or sh61 cells cultured at normoxia or hypoxia (6 h). Data shown are representative of three biological replicate experiments. (D,E) Growth curves of PyMT EV, sh59 or sh61 cells cultured at normoxia (D) or hypoxia (E) in growth medium supplemented with 2% FBS. Cell proliferation was measured in replicate plates at each time point (24, 48, 72 or 96 h) using the WST-1 assay. For both oxygen tensions, the overall mean of the percentage of proliferating cells relative to EV cells at t = 0 h ± SEM is presented, calculated as the average of mean cell number for n = 3 technical replicates/time point/genotype as observed over three biological replicate experiments. All data were analyzed by two-way ANOVA; N.S. = not significant. (F) PyMT EV, HIF-1 KO, sh59 KD, and sh61 KD cells were seeded into 6-well dishes such that they would be 100% confluent the next day. Following wounding, the percentage of open wound area in each field of view was measured and expressed as a ratio per the total area of the field of view. Data were analyzed by two-way ANOVA with a Bonferroni correction post-test. Data are representative of three biological replicate experiments. (G) The overall mean fold change in the invasion index after data were normalized to EV cells cultured at normoxia (fold change set to 1.0; n = 3 three independent biological replicate experiments). Data were analyzed by ANOVA with a Bonferroni post-test.

