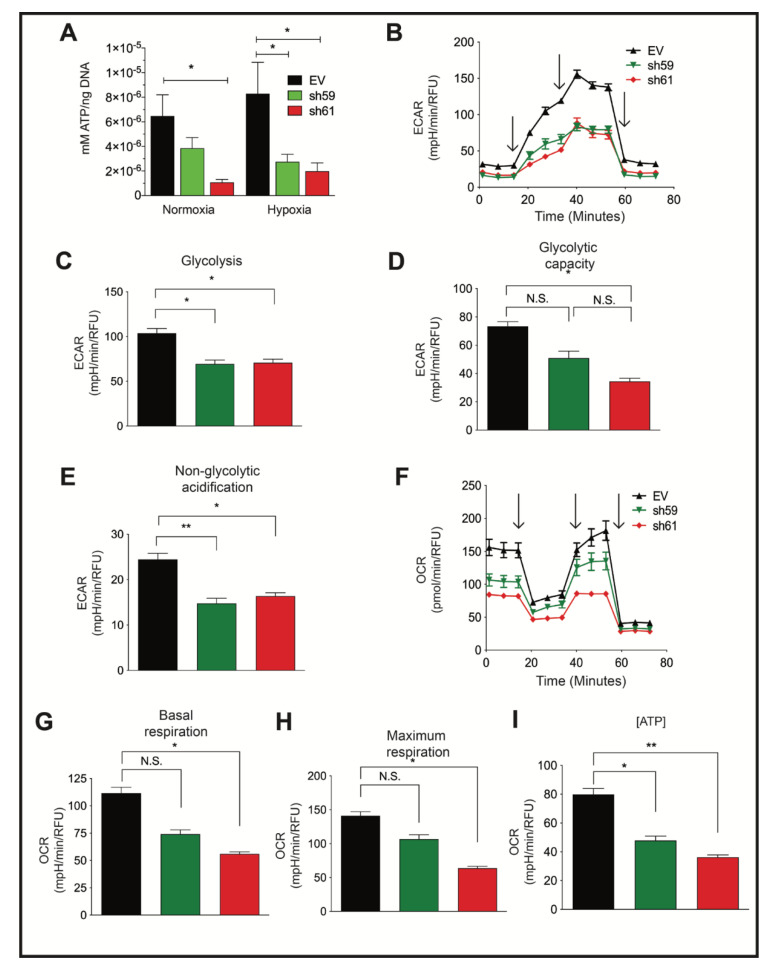
Figure 3.
Ckb knockdown in PyMT cells reduces ATP levels and impairs both glycolysis and mitochondrial respiration. (A) PyMT EV, sh59 and sh61 cells were plated in triplicate and grown to 80% confluence prior to normoxic or hypoxic culture (24 h). Cells were harvested, washed with ice-cold PBS, and immediately lysed on the plate for comparison of the intracellular ATP levels by a bioluminescent assay, and data were normalized to total DNA content. The mean ATP concentration (mM) per ng of DNA ± SEM is shown (n = 3 technical replicates per cell line/oxygen tension). The data shown are representative of three independent biological replicates. (B–I) PyMT EV, sh59 Ckb KD, and sh61 Ckb KD cells were profiled for metabolic activity using Seahorse bioanalyzer assays (Glycolysis Stress or Mito Stress test kits) to measure changes in parameters associated with either ECAR, panels (B–E), or with mitochondrial respiration (OCR, panels (F–I)). The black arrows (B,F) indicate when injections occurred during the assays. Changes were observed in ECAR plotted over time (B), peak glycolysis (C), glycolytic capacity (D), non-glycolytic acidification (E), OCR over time (F), basal respiration (G), maximum respiration (H), and ATP-linked respiration (I) in sh61 Ckb KD cells. For some of the measured outputs, there were also significant changes observed in sh59 Ckb KD cells. Panels (B,F) are representative of three independent experiments. For panels (C–E,G–I), the bar graphs represent the overall mean of three independent experiment means across n = 6 technical well replicates/genotype/experiment. Each genotype of cells was randomly plated in different patterns during each independent experiment to minimize any potential effects of plate well location on measurements.

