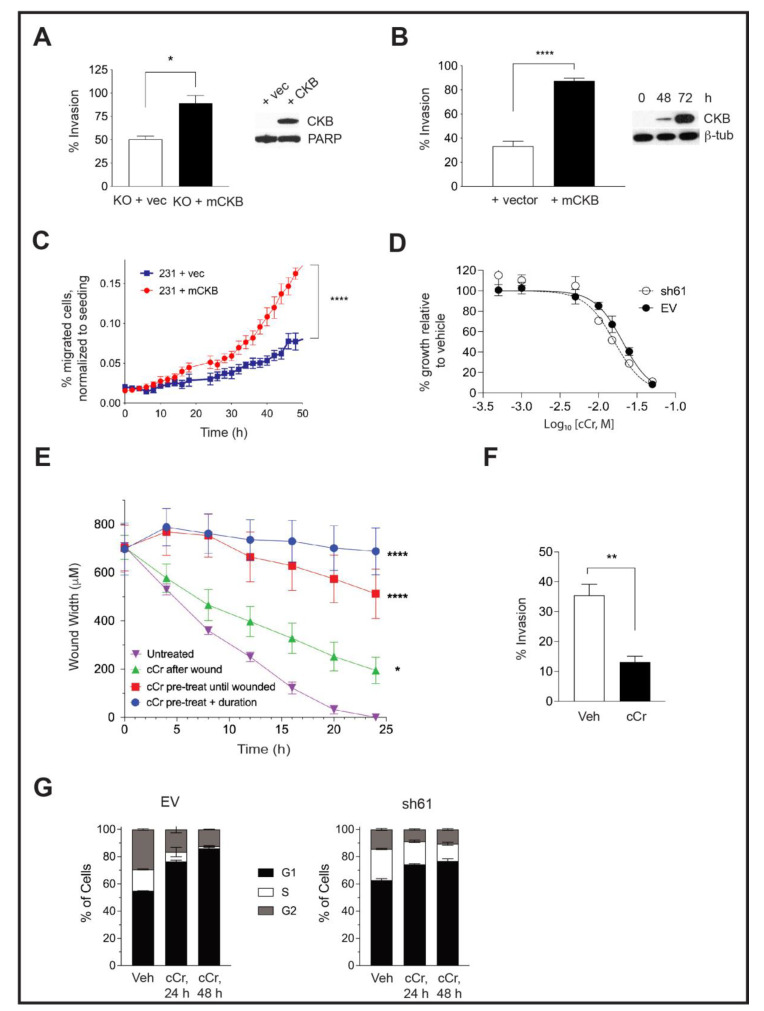
Figure 4.
Ectopic expression of CKB in HIF-1 KO PyMT cells or in human MDA-MB-231 TNBC cells enhances cell invasion, but cCr treatment represses wound healing, invasion, and cell cycle progression. (A) The percentage of invading cells was compared between PyMT HIF-1 KO + vector control (+vec) and PyMT HIF-1 KO + mCKB (+CKB) cells over three biological experiments; the overall mean ± SEM is shown. The insert shows CKB expression by Western blotting relative to total PARP (loading control). (B) The percentage of invading cells in MDA-MB-231 TNBC cells transfected with vector alone (+vector) or with mCKB (+mCKB); cells were plated for invasion assays 72 h post-transfection, when CKB levels were maximally expressed (Western blot insert, β-tubulin as a loading control). (C) Chemotaxis assays were performed in transiently transfected MDA-MB-231-NR cells using IncuCyte ClearView plates. The mean percentage of migrated cells/total cells seeded was compared between genotypes over time during chemoattraction to 10% FBS. Data are representative of two independent experiments. (D) Cells were exposed to increasing doses of cCr, as described in the Materials and Methods and imaged for 96 h. Percentage growth inhibition was set relative to vehicle control and then plotted vs. log of the molar concentration and fitted with a nonlinear regression curve analysis. The graph is representative of at least 3 independent biological replicates. (E) PyMT EV cells were plated onto ImageLock plates. Then, cells were either pre-treated with cCr prior to wounding and cCr added post-wounding; cells were pre-treated with cCr prior to wounding, but cCr removed post-wounding; or fresh media with cCr was added only after wounding. Data are representative of at least two biological replicates. (F) PyMT EV cells were seeded in an invasion assay in which cells in the upper chamber were exposed to either vehicle or to 25 mM cCr and then cultured for 48 h. (G) PyMT EV or sh61 cells were treated with 25 mM cCr for either 24 h or 48 h, and cell cycle analysis was performed by PI staining to assess changes in cell cycle progression. The mean ± SEM is shown for each phase of the cell cycle (n = 3 technical replicates/genotype/time point). Data are representative of three independent experiments.

