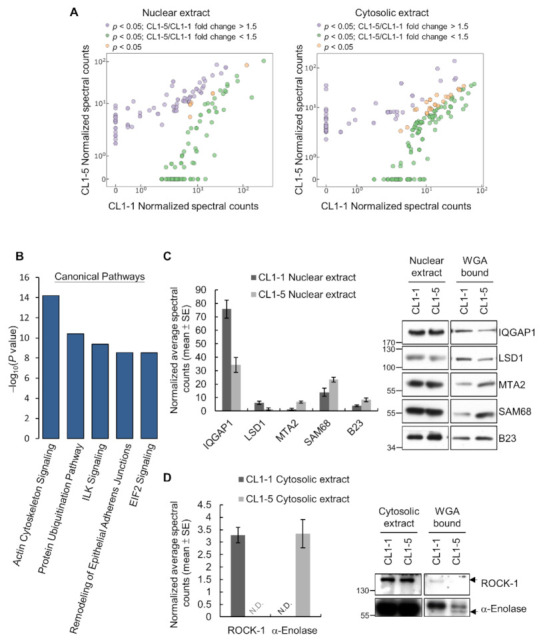
Figure 2.

Differential WGA-bound glycoproteins identified in CL1-1 and CL1-5 cells. (A) Scatter plots of the normalized spectral counts of proteins with statistically significant (Student’s t-test, p-value < 0.05) fold changes in their amounts in WGA-enriched nuclear or cytosolic fractions from CL1 and CL1-5 cells. (B) Top canonical pathways identified by IPA of differential WGA-bound glycoproteins. (C–D) Validation of representative differential WGA-bound nuclear (C) and cytosolic (D) glycoproteins by Western analysis. Shown on the left are bar graphs of average normalized spectral counts listed in Tables S1 (C) and S2 (D); N.D., not determined. Representative Western results are shown on the right. Detailed information about the Western blotting can be found in Figure S8.
