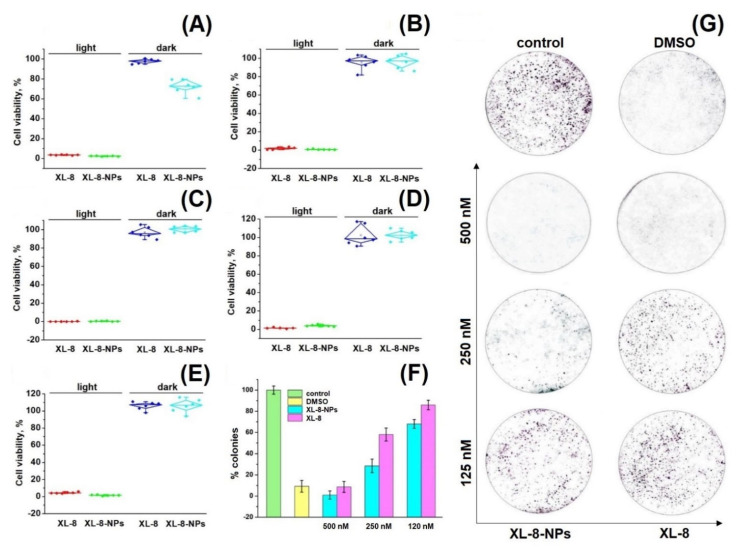
Figure 3.
Photo- and cytotoxicity of XL-8 (500 nM) and XL-8-NPs (500 nM) analyzed by MTT assay. The percentage of cell viability was determined relative to viable control cells. SK-OV-3 cells (A), A549 cells (B), HeLa cells (C), MCF7 cells (D), and 4T1 cells (E) measured at 72 h after treatment. The quantification of colony formation rate in HeLa cells after treatment with 10% DMSO and XL-8- or XL-8-NPs-based PDT (F). Giemsa-stained plates of colony formation assay carried out on HeLa cells (G).

