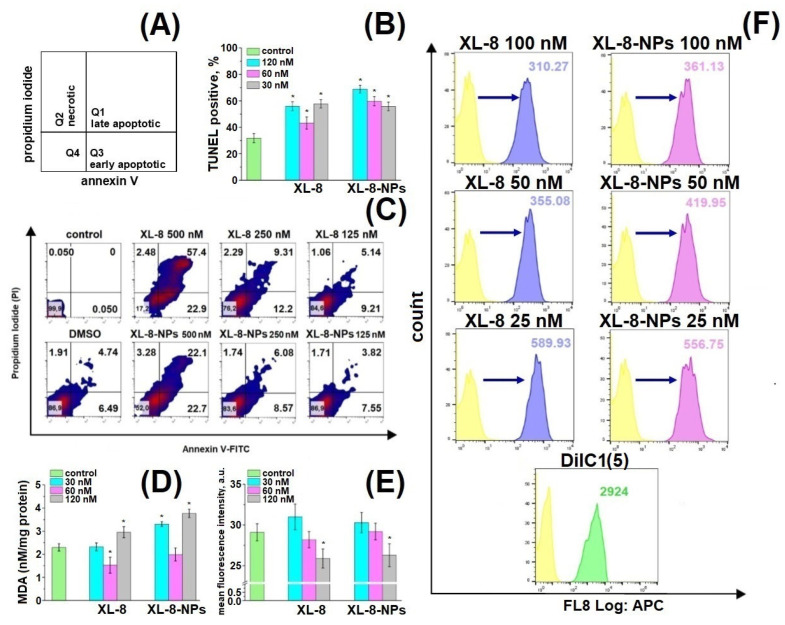
Figure 6.
Schematic distribution of late apoptotic, early apoptotic, and necrotic populations in the corresponding quadrants (A). Percentage of TUNEL-positive HeLa cells treated with XL-8 and XL-8-NPs and irradiated. * p < 0.05 compared with the TUNEL treated group (control) (B). Apoptotic and necrotic HeLa cell populations after XL-8- or XL-8-NPs-based PDT. DMSO corresponds to 2% solution in DMEM (C). MDA analysis in HeLa cells. * p < 0.05 compared with the control group (TBA treated) (D). MFI of HeLa cells treated with XL-8 and XL-8-NPs, irradiated, and stained with o-phthaldialdehyde. * p < 0.05 compared with the control group (o-phthaldialdehyde treated cells) (E). Mitochondrial membrane potential (MMP, ΔΨm) of HeLa cells treated with XL-8 and XL-8-NPs, irradiated (F). The results are shown as the mean ± S.D. (n = 3).

