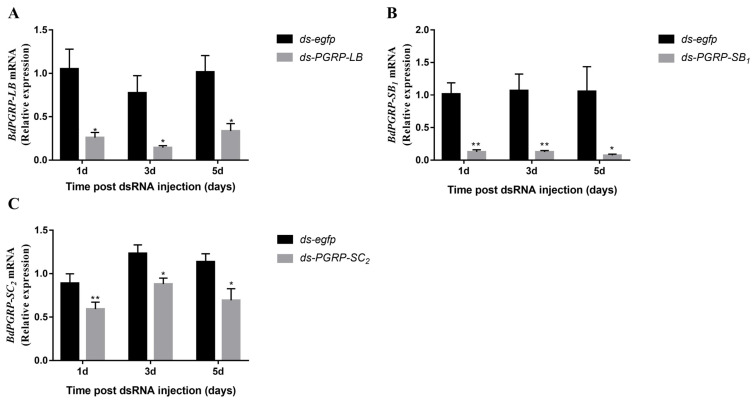
Figure 5.
RNA interference efficiency of BdPGRPs. Relative expression of PGRP-LB (A), PGRP-SB1 (B), and PGRP-SC2 (C) after dsRNA injection at different time points with whole body samples. All error bars represent the SEM of the mean of three independent biological replicates. Statistical analysis was based on Student’s t-test. * p < 0.05; ** p < 0.01. The relative gene expression data were analyzed using a 2−ΔΔCT method and the data were normalized to reference gene Rpl32.

