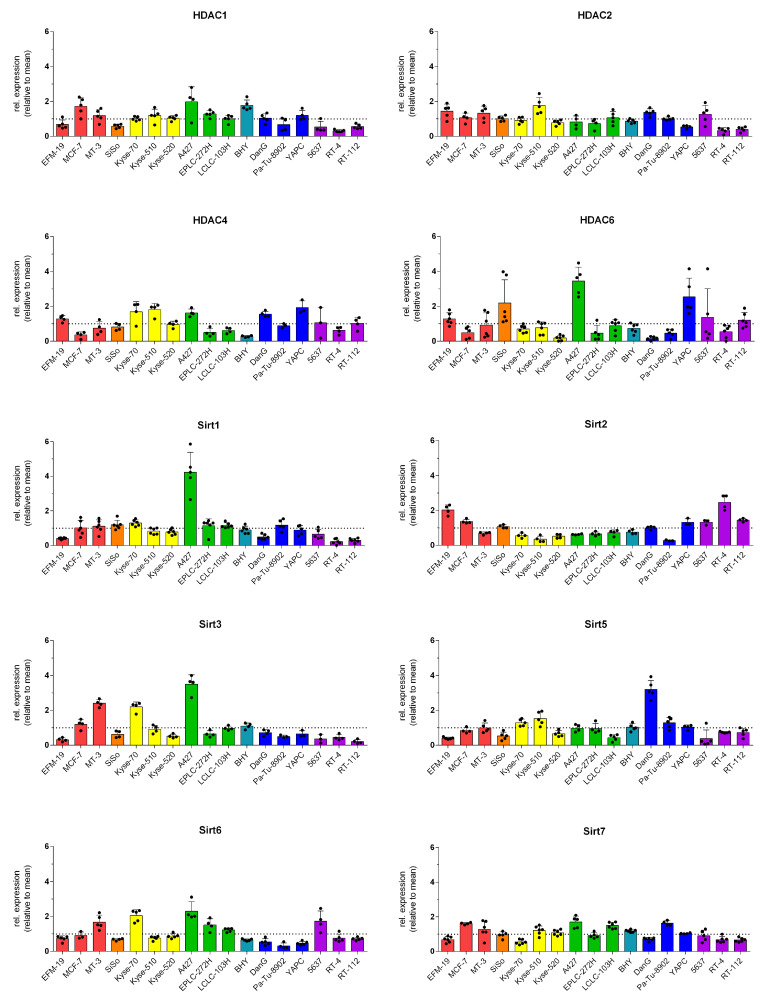
Figure 5.
Relative protein expression profiles of HDAC/Sirt isoenzymes in 17 human cancer cell lines (relative to the mean expression over all cell lines) [mean ± SD of three independent determinations; breast carcinoma (red), cervix carcinoma (orange), oesophageal carcinoma (yellow), lung carcinoma (green), oral squamous carcinoma (cyan), pancreas carcinoma (blue), and urinary bladder carcinoma (purple)].

