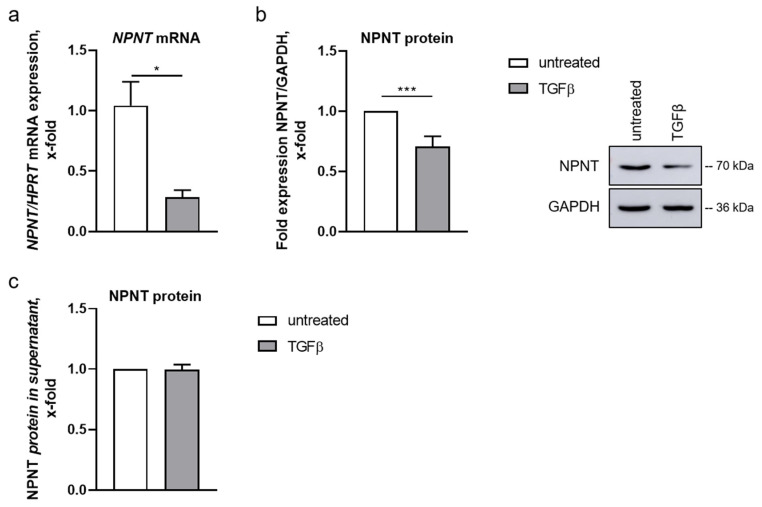
Figure 2.
NPNT expression and localization in human podocytes. (a,b): NPNT mRNA (a) and protein (b) expression in cultured human podocytes, untreated and after TGF-β treatment. NPNT expression was normalized to HPRT and GAPDH, respectively, and is given as change compared to untreated cells. A representative Western blot picture is shown. n = 3–17 independent experiments, * p < 0.05, *** p < 0.001. (c): Change in NPNT protein concentration measured in the cell culture supernatant of untreated cultured human podocytes and after stimulation with TGF-β. n = 5 independent experiments.

