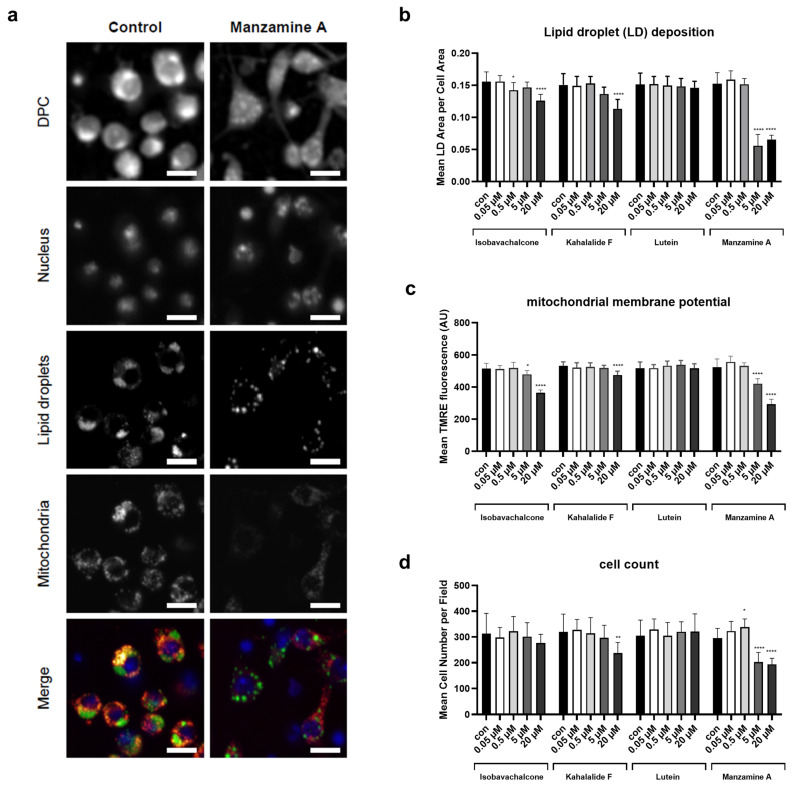
Figure 4.
High content microscopy assay with Drosophila melanogaster S2R+ cells. S2R+ cells were incubated for 18 h with the different concentrations of the compounds Isobavachalcone, Kahalalide F, Lutein and Manzamine A. The control group was treated with DMSO (0.2%). (a) Representative picture of the high content staining in control and Manzamine A (20 µM) treated cells where merge is from nucleus (blue, Hoechst 33342), lipid droplets (green, BODIPY FL C12) and mitochondria (red, TMRE). Digital phase contrast is calculated from transmitted light images and shows the unstained cell morphology. Scale bar = 10 µm. (b) Quantification of mean LD area per cell. (c) Quantification of mean mitochondrial membrane potential per cell. (d) Quantification of cell number per field. Individual cells were analyzed from four fields per well of biological triplicates. One-way ANOVA for each compound, confidence interval 95%. In all panels, asterisks (*) denote statistical significance: * p value ≤ 0.05, ** p value ≤ 0.01, **** p value ≤ 0.0001 compared with control.

