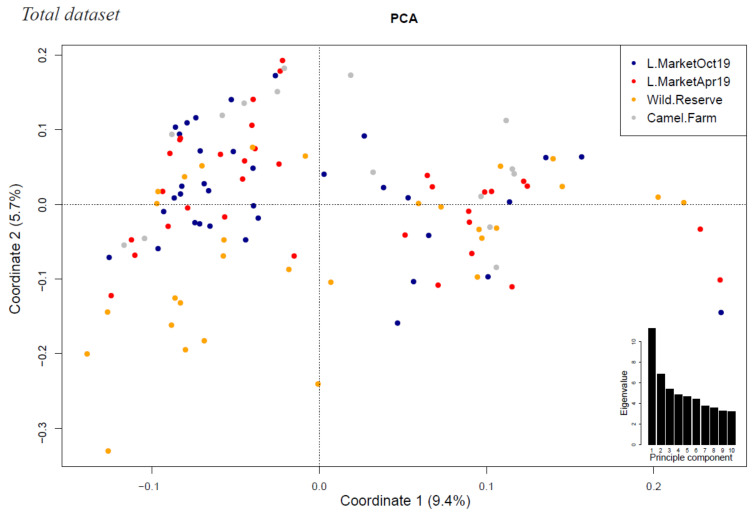
Figure 1.
Principal component analysis of the population structure at three collection sites over two sampling periods. Variance explained by Coordinates 1 and 2 are given as percentages on the axes’ labels. Individual animals are plotted on the first two principal components, colored by sampling site (livestock market (“L.Market”) over two sampling periods (April and October 2019 denoted by red and dark blue, respectively), Dubai Desert Conservation Reserve (“Wild.Reserve”) denoted by yellow, and a Bedouin camel farm (“Camel.Farm”) denoted by grey). The inset shows a bar plot of the eigenvalues for the first 10 principal components.

