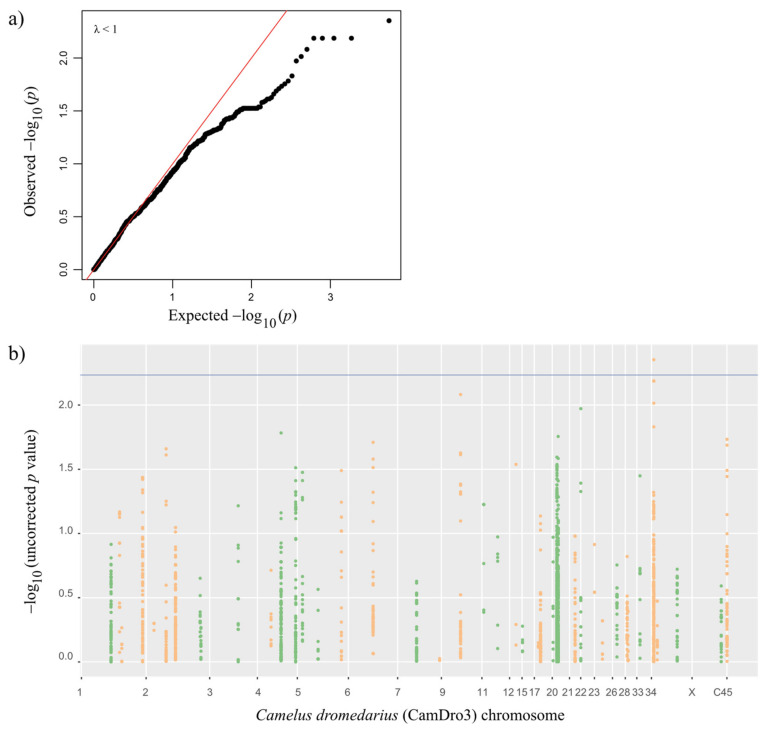
Figure 2.
Univariate logistic regression results. (a) QQ plot and (b) Manhattan plot, with false discovery rate (FDR) threshold depicted in blue. −log10(p) values for SNPs alternate from green to orange to delineate chromosomes adjacent in the plots. C45 corresponds to Contig45, an unplaced scaffold in the CamDro3 reference.

