Figure 4.
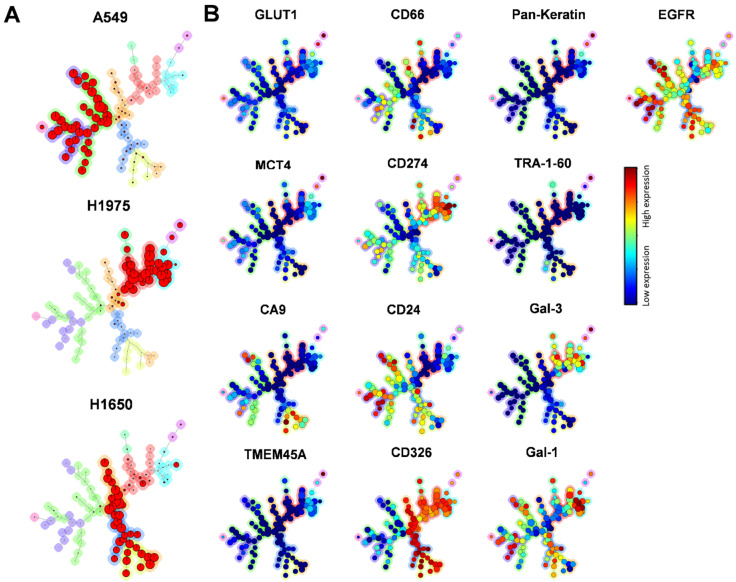
FlowSOM analysis of A549, H1975, and H1650 cells. (A) The lineages of tumor cell-line subpopulations were traced and visualized by unsupervised FlowSOM, an algorithm creating MSTs during automated, unsupervised clustering in Cytobank. The A549, H1975, and H1650 cells, based on their different marker-expression profiles, were plotted on different branches (red) of MSTs as cells with inter-cell-line heterogeneity (A549: left branch; H1975: right branch; H1650: lower branch). (B) Protein expressions of the three studied cell lines on the aggregated MSTs. Similar cells are assigned to the same node, and the size of node corresponds to the number of events within that cluster; the main subsets are highlighted in the graph. The expression intensities are indicated with coloration varying from blue (low expression) to red (high expression).

