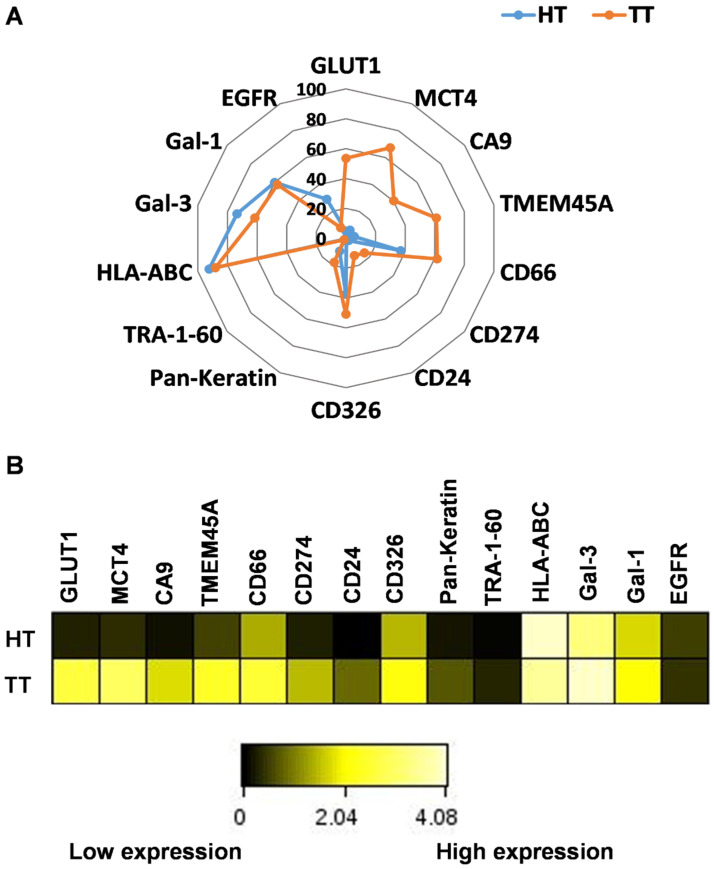
Figure 6.
The pattern of the expression of the 14 proteins investigated in primary human lung adenocarcinoma cells. (A) Radar plot delineates the trajectories of the percentage of cells positive for the investigated markers. The higher positivity for GLUT1, MCT4, CA9, TMEM45A, CD66, CD274, CD24, CD326, and pan-keratin associated with TT versus HT. (B) Differences in the expression of carcinoma markers regarding protein density (median metal intensity) in single cells were visualized on a heatmap (calculated transformed ratio of medians by the table minimum).

