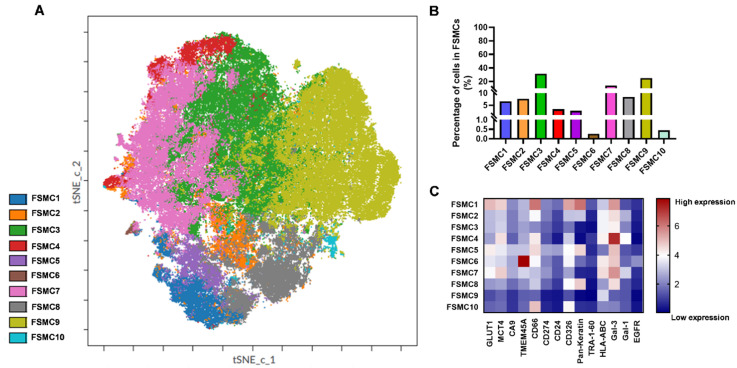
Figure 8.
Unsupervised population analysis determined 10 FSMCs displayed on a viSNE map of the TT specimen. The distribution of FlowSOM metaclusters on the single-cell tSNE-CUDA plot (A). The percentage of cells in the FSMCs (B). Heatmap of the expression intensities of the measured 14 proteins in the FSMCs followed by arcsinh transformation (scale factor 5) (C).

