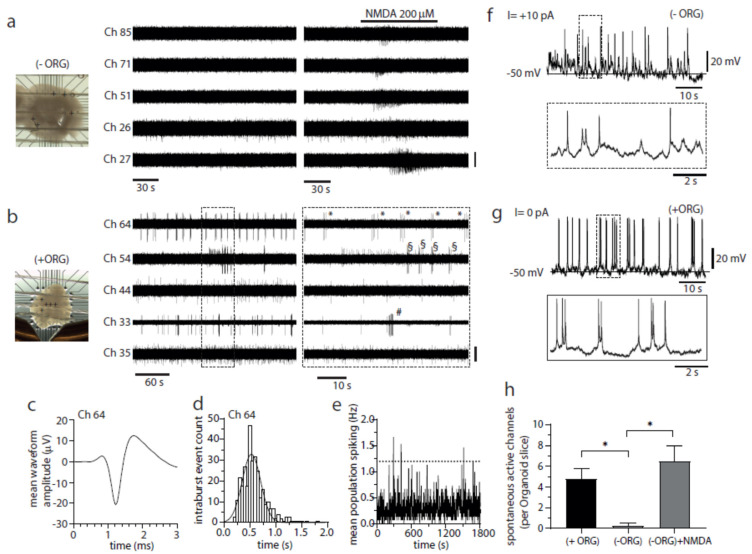
Figure 4.
Incorporated IBA1+ population promotes neuronal bursting and network activity in cerebral organoids. (a) Image of an (−)ORG slice recorded with a 3D 8 × 8 MEA (left) and raw voltage recordings of spiking activity from five representative electrodes (depicted as + symbols on image) before and after NMDA perfusion (middle and right panels). Only channel 26 exhibited activity in baseline conditions (one active electrode detected from 4 organoid slices), while NMDA perfusion effectively and quickly elicited a brief burst of activity on all five channels (bar, 20 µV). (b) As described above in a but for a (+)ORG slice. The regular bursting activity of 3–7 spikes was detected in three electrodes (33, 54, 64) (twenty-four active electrodes detected from 5 -organoid slices). Symbols (*, # and §) mark individual bursts in each different channel (bar, 20 µV, except for Ch 33, 40 µV). (c) Mean spike waveform after spike sorting (255 spikes) using principal component analysis from raw signal depicted in b from channel 64. A single tight cluster with a well-defined AP waveform was detected consistent with the recording being from a single neuron (single unit activity, SUA). (d) Intra-burst spike interval histogram (50 ms bins) for SUA from channel 64 presented in (b,c). Ten of total 24 active electrode tracks detected from 5 (+)ORG slice-organoids exhibited signs of bursting. The single Gaussian function fitted to the data is centred at 524 ± 178 ms (mean ± SD) while the mean inter-burst interval for this neuron was 10.7 ± 4.2 s (mean ± SD). (e) Mean population spike activity from all the active electrodes the (+)ORG slice presented in b (in 1 s bins). Although individual electrodes exhibited bursting activity, this activity was largely asynchronous between electrodes, as seen by the typical flattened population spiking response over the time course of 10 min (dotted line represents network burst threshold set at 6 times the SD of the baseline). (f) Electrophysiological traces from whole-cell recording from a (−)ORG neuron exhibiting a current-induced (+10 pA) low amplitude, short term bursting behaviour. (g) Electrophysiological traces from whole-cell recording from a (+)ORG neuron exhibiting high amplitude, robust, regular bursting behaviour from its resting membrane potential. (h) Bar chart comparison of active electrode tracks recorded per organoid slice. (+)ORG slices exhibited a statistically significant larger number of detected active electrode tracks compared to (−)ORG slices. This lack of spontaneous activity could be reversed by perfusion of NMDA that caused the emergence of transient activity on previously silent electrodes recorded from (−)ORG slices (1 vs. 24 active electrodes, n = 4 (−)ORGs and n = 5 (+)ORGs, respectively, from two independent batches). All recording were made from organoids of the iPCS line MBE2968.

