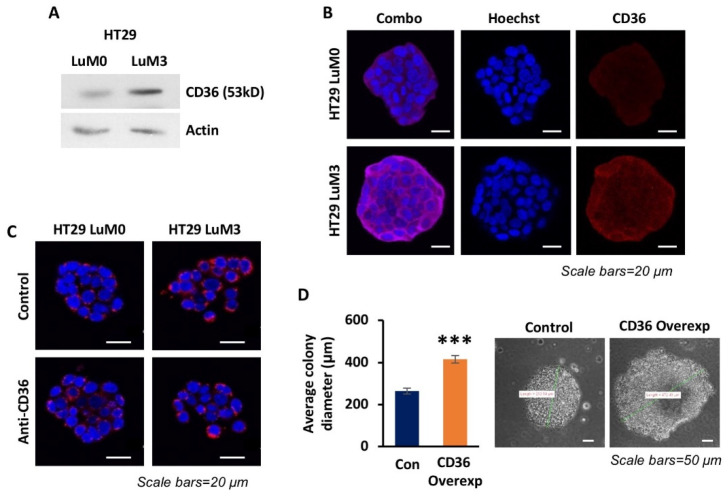
Figure 2.
CD36 expression is associated with more metastatic CRC cell lines. (A) Western blot analysis of the HT29 LuM0 and LuM3 GFP-Luciferase cell lines. (B) Confocal microscopy images of HT29 LuM0 and LuM3 GFP-Luciferase cells for CD36 expression (red), nucleus (blue) and actin filaments (purple). (C) Confocal microscopy images of the HT29 LuM0 and LuM3 GFP-Luciferase fatty acid uptake assay control or treated with anti-CD36 blocking antibody for 24 h (lipid analogue—red; DAPI—blue). (D) Quantification and representative images of the HT29 LuM0 p-lenti-control and p-lenti-CD36 overexpression soft agar colony formation assays. N = 3, *** p < 0.001, SEM.

