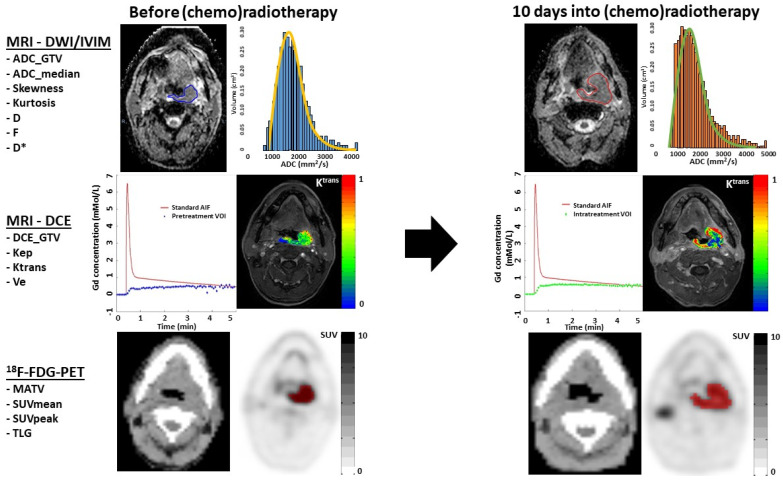
Figure 1.
Overview of ADC, IVIM, DCE and FDG-PET imaging acquisition in a patient with left tonsillar carcinoma before and 10 days into (chemo)radiotherapy, and with whom locoregional failure occurred. The upper row shows the ADC map on which the tumor is delineated, in order to extract DWI and IVIM parameters. The subtle spatial mismatch was due to a slightly different angulation of the neck. The ADC histogram shows high pretreatment positive ADC_skewness (blue histogram), and an increase towards a higher intratreatment ADC_skewness (orange histogram). Furthermore, a high pretreatment ADC_kurtosis was associated with LRF (orange line). The middle row shows the population-based arterial input function (AIF) and a tumor concentration time curve. The images are DCE images at the 75 temporal phase, on which a colored functional map of the parameter Ktrans is superimposed in the delineated tumor. The color scale shows the range between 0 and 1 mMol/L. The 18F-FDG-PET image in the lowest row shows the tumor delineation (red ROI) on the attenuation-corrected 18F-FDG-PET image (black/white SUV scale ranges between 0 and 10), with a threshold of >50% SUV_peak and in anatomical correlation with a diagnostic CT scan.

