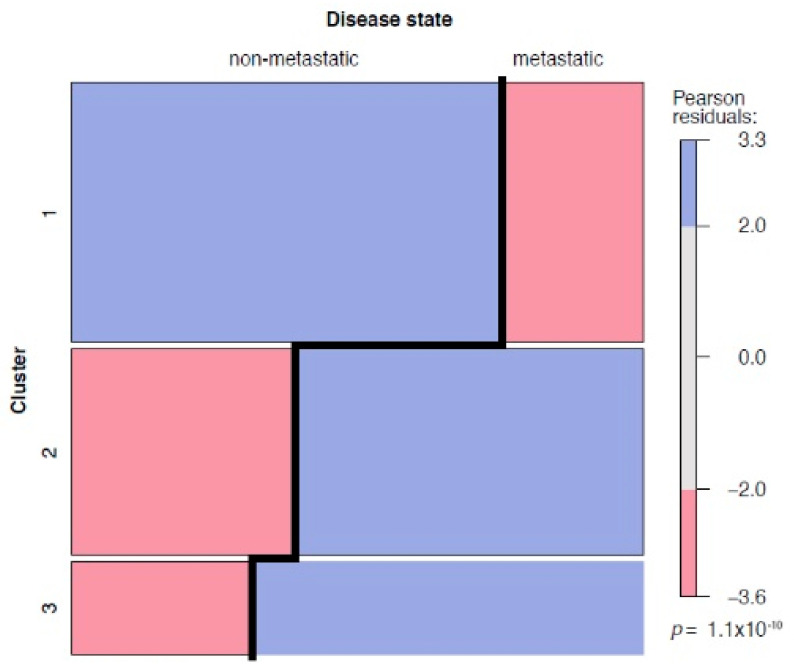
Figure 6.
Left and right columns show the associations of clusters with either non-metastatic (left column, primary tumor M0 group) or metastatic disease state (right column, primary tumor M+ group and metastatic tissue Mtx group). Blue boxes indicate over-represented disease states in a cluster (Pearson residuals > 2), whereas red boxes correspond to under-represented disease states (Pearson residuals < −2), providing statistical evidence that clustering is not independent from the metastatic disease state (p = 1.1 × 10⁻¹⁰).

