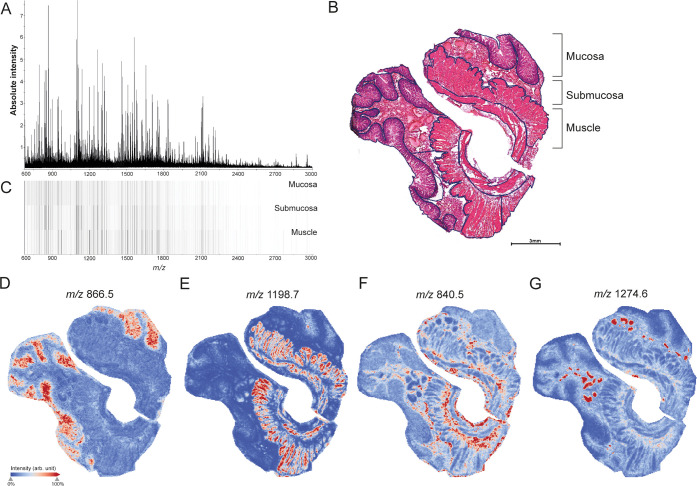
Figure 4.
MALDI-TOF MSI of distinct histological structures in the human small intestine. (A) Average mass spectrum of whole tissues (Ctrl). (B) H&E staining showing annotation of histological layers, mucosa, submucosa, and muscle. See also Figure S7 for region annotations in all tissues. (C) Heatmap visualizing intensity differences for average mass spectra obtained from mucosa, submucosa, and muscle layers of the small intestine. Individual peptide images of m/z values with specific localization in (D) mucosa (m/z 886.5 ± 0.2 Da), (E) muscle (m/z 1198.7 ± 0.2 Da), (F) submucosa (m/z 840.5 ± 0.2 Da), and blood vessels (m/z 1274.6 ± 0.2 Da). All peptide images were generated from TOF-MSI data.

