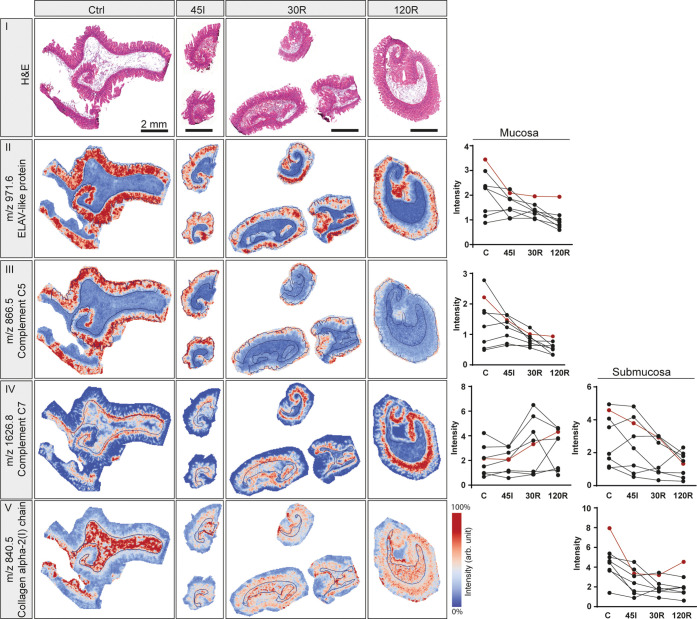
Figure 6.
Selection of annotated proteins using MALDI-TOF MSI in combination with FTICR and LC-MS/MS. H&E staining (I) and peptide images from one patient are shown for indicated m/z values, which were annotated as ELAV-like protein (II), complement C5 (III), complement C7 (IV), and collagen α2(I)chain (V). Graphs show intensities for all patients in the mucosa (left) and/or submucosa (right) in case the m/z was differentially expressed in the respective layer. Intensities corresponding to the presented peptide images are shown in red. All peptide images were generated from TOF-MSI data for the indicated m/z values ±0.2 Da. See also Figure S10 for peptide images from all patient samples.

