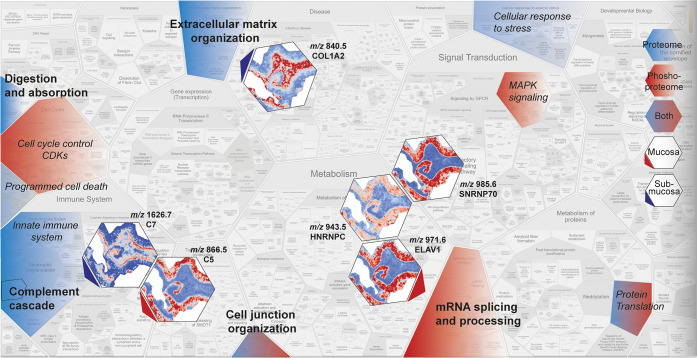
Figure 7.
Summary of MS-based proteome and phosphoproteome functional enrichment analysis and imaging MS data showing that these methods complement as well as support each other. Overview summarizing regulated processes during IR based on the dynamic proteome (blue) and phosphoproteome (red) or both (blue-red). Processes that were shown to be significantly enriched are indicated in bold. Peptide images show significantly changing peptides, specifically located in the mucosa (red arrow) or submucosa (blue arrow). The annotated proteins were related to indicated processes (arrow). The overview image was adjusted from ReacFoam format (Reactome.org). C5, complement 5; C7, complement 7; SNRNP70, small nuclear ribonucleoprotein U1 subunit 70; HNRNPC, heterogeneous nuclear ribonucleoprotein C; ELAV1, ELAV-like protein 1; and COL1A1, collagen 1 α2 (I) chain.

