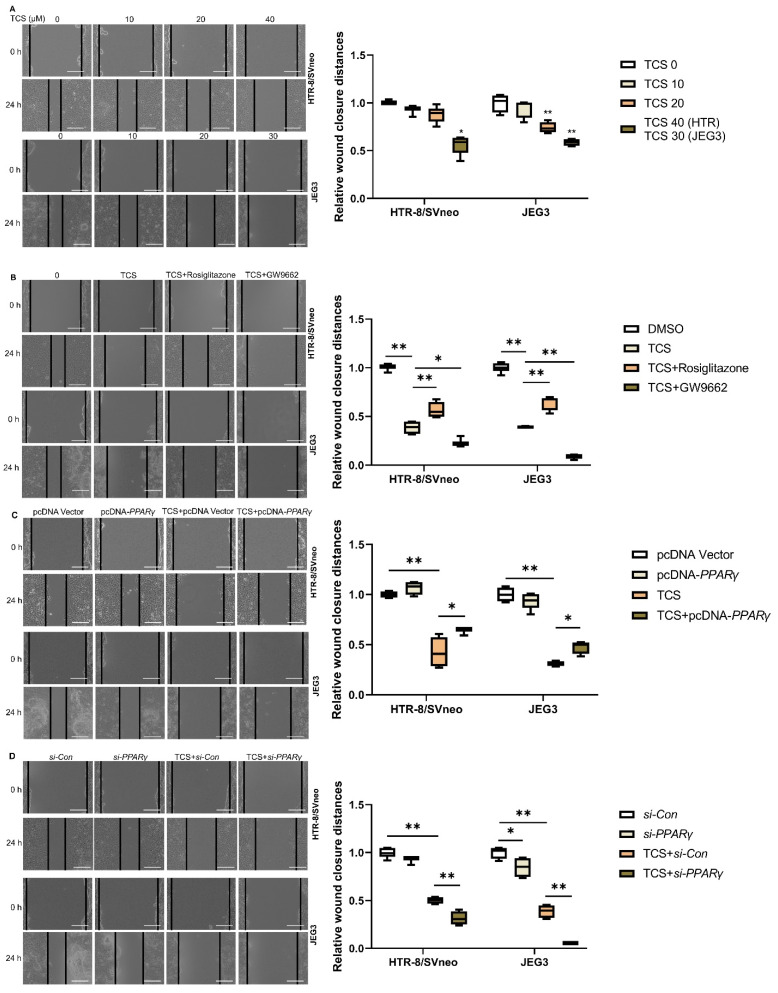
Figure 2.
Role of PPARγ in migration exposed to TCS in vitro. The migration distances were measured after exposure to TCS at 0 h and 24 h. (A) HTR-8/SVneo and JEG-3 cell migration distance was decreased with increasing concentration of TCS. Co-treated with TCS in the absence or presence of rosiglitazone or GW9662 in HTR-8/SVneo and JEG-3 cells (B). The migration distance in response to PPAR overexpression (C) and knockdown (D) when exposed to TCS. Scale bar: 200 µm. The relative wound closure distances are shown on the right. The data are shown as the means ± S.E.M. * p < 0.05; ** p < 0.01; compared with the indicated group, n = 3.

