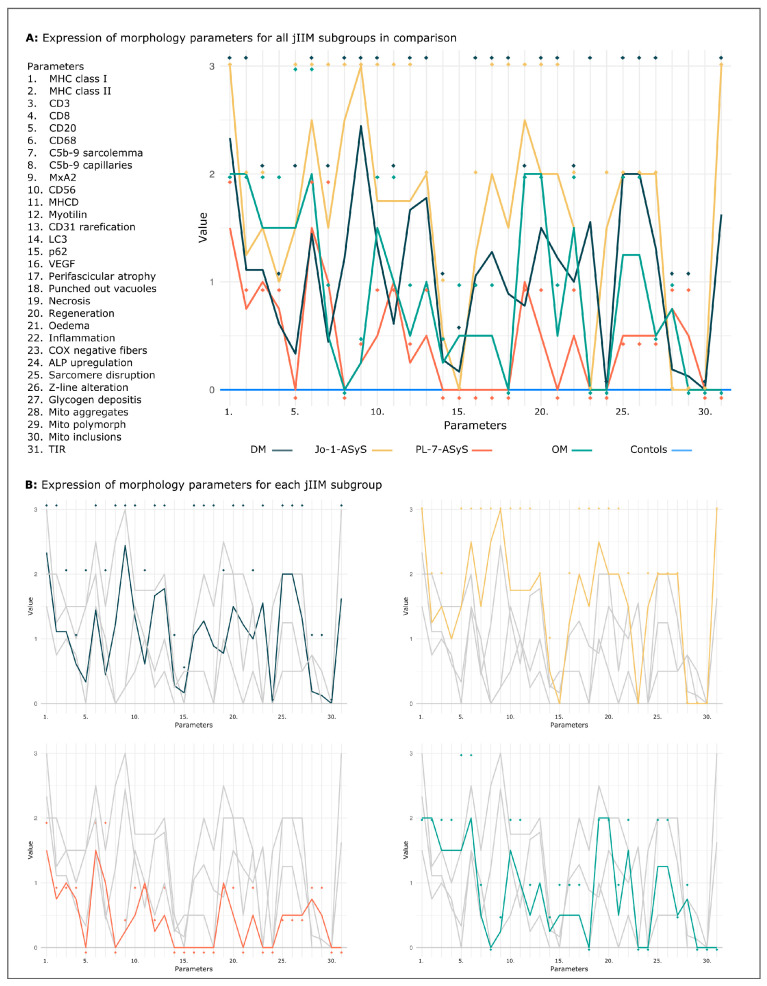
Figure 9.
Visual exploration of the values. Common and discriminative morphological patterns in jIIM subgroups DM, ASyS, OM, and controls for 31 parameters, shown as mean (coloured lines) and maximum values (rhombus) per subgroup as an overview (A) and separated by subgroups (B). The minimum values per subgroup representing weak morphological characteristics are not shown. Healthy control (blue line) shows the normal pattern. Note the visible similar trend of the pattern of DM and Jo-1- ASyS compared to that in PL-7- ASyS and OM. For all parameters, the p-value did not reach statistical significance. (DM = dermatomyositis; ASyS = antisynthetase syndrome; OM = overlap myositis, TIR = tubuloreticular inclusions).

