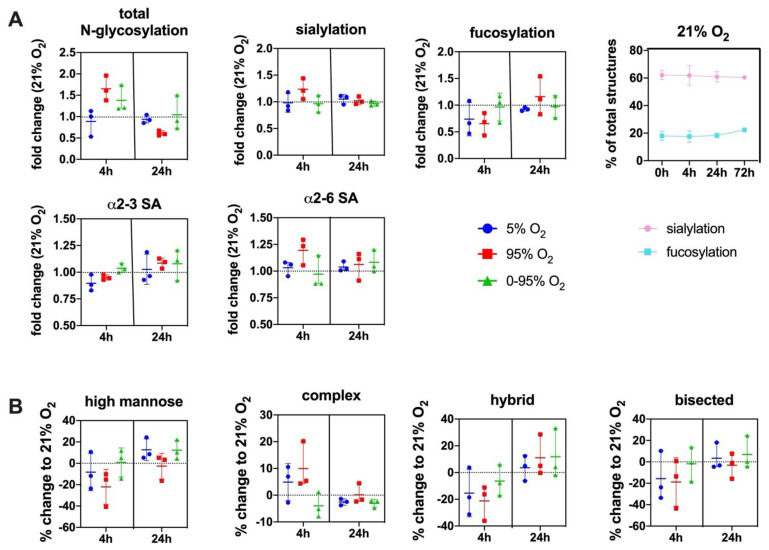
Figure 4.
(A) Changes in the overall N-glycosylation, sialylation and fucosylation of N-glycans under different O2 conditions over time. SA = sialic acid. Top right panel: Change of overall sialylated and fucosylated N-glycans as the % of total N-glycans over the duration of the experiments (0–72 h) under normoxic (21% O2) conditions. (B) Change in abundance of different N-glycan types over time under different O2 conditions relative to control condition (21% O2). Values are given as individual measurements (n = 3) including the mean ± range or mean ± SD (top right panel): (A): fold change relative to 21% O2 or% of total N-glycan structures (B) % change relative to 21% O2.

