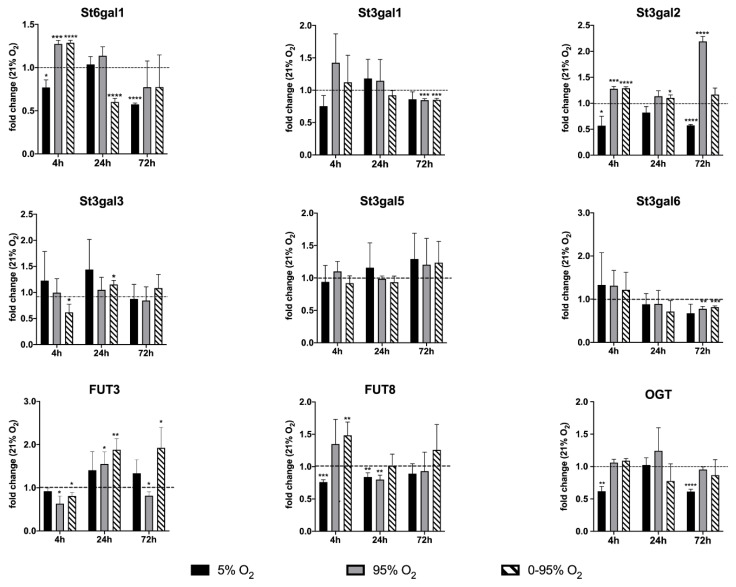
Figure 6.
Expression analysis of glycosyl transferase mRNA levels by qRT-PCR. Values are given as the fold change relative to the control condition (normoxia: 21% O2). For statistical analysis, Student’s t-test was used to compare each group to the control group. * p < 0.05; ** p < 0.01; *** p < 0.001; and **** p < 0.0001.

