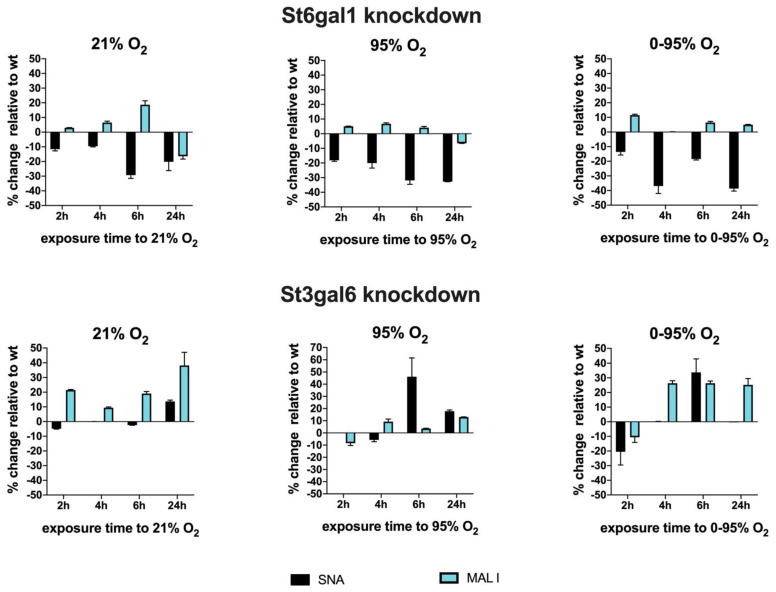
Figure 7.
siRNA knockdown of St6gal1 and St3gal6 sialyl transferases and analysis of cell surface binding of lectins SNA and MAL I. Exposure to different oxygen conditions started 36 h after transfection with siRNAs. Values are given as% change of lectin binding (MFI) relative to sham transfected cells. Wildtype (wt), (mean ± SD).

