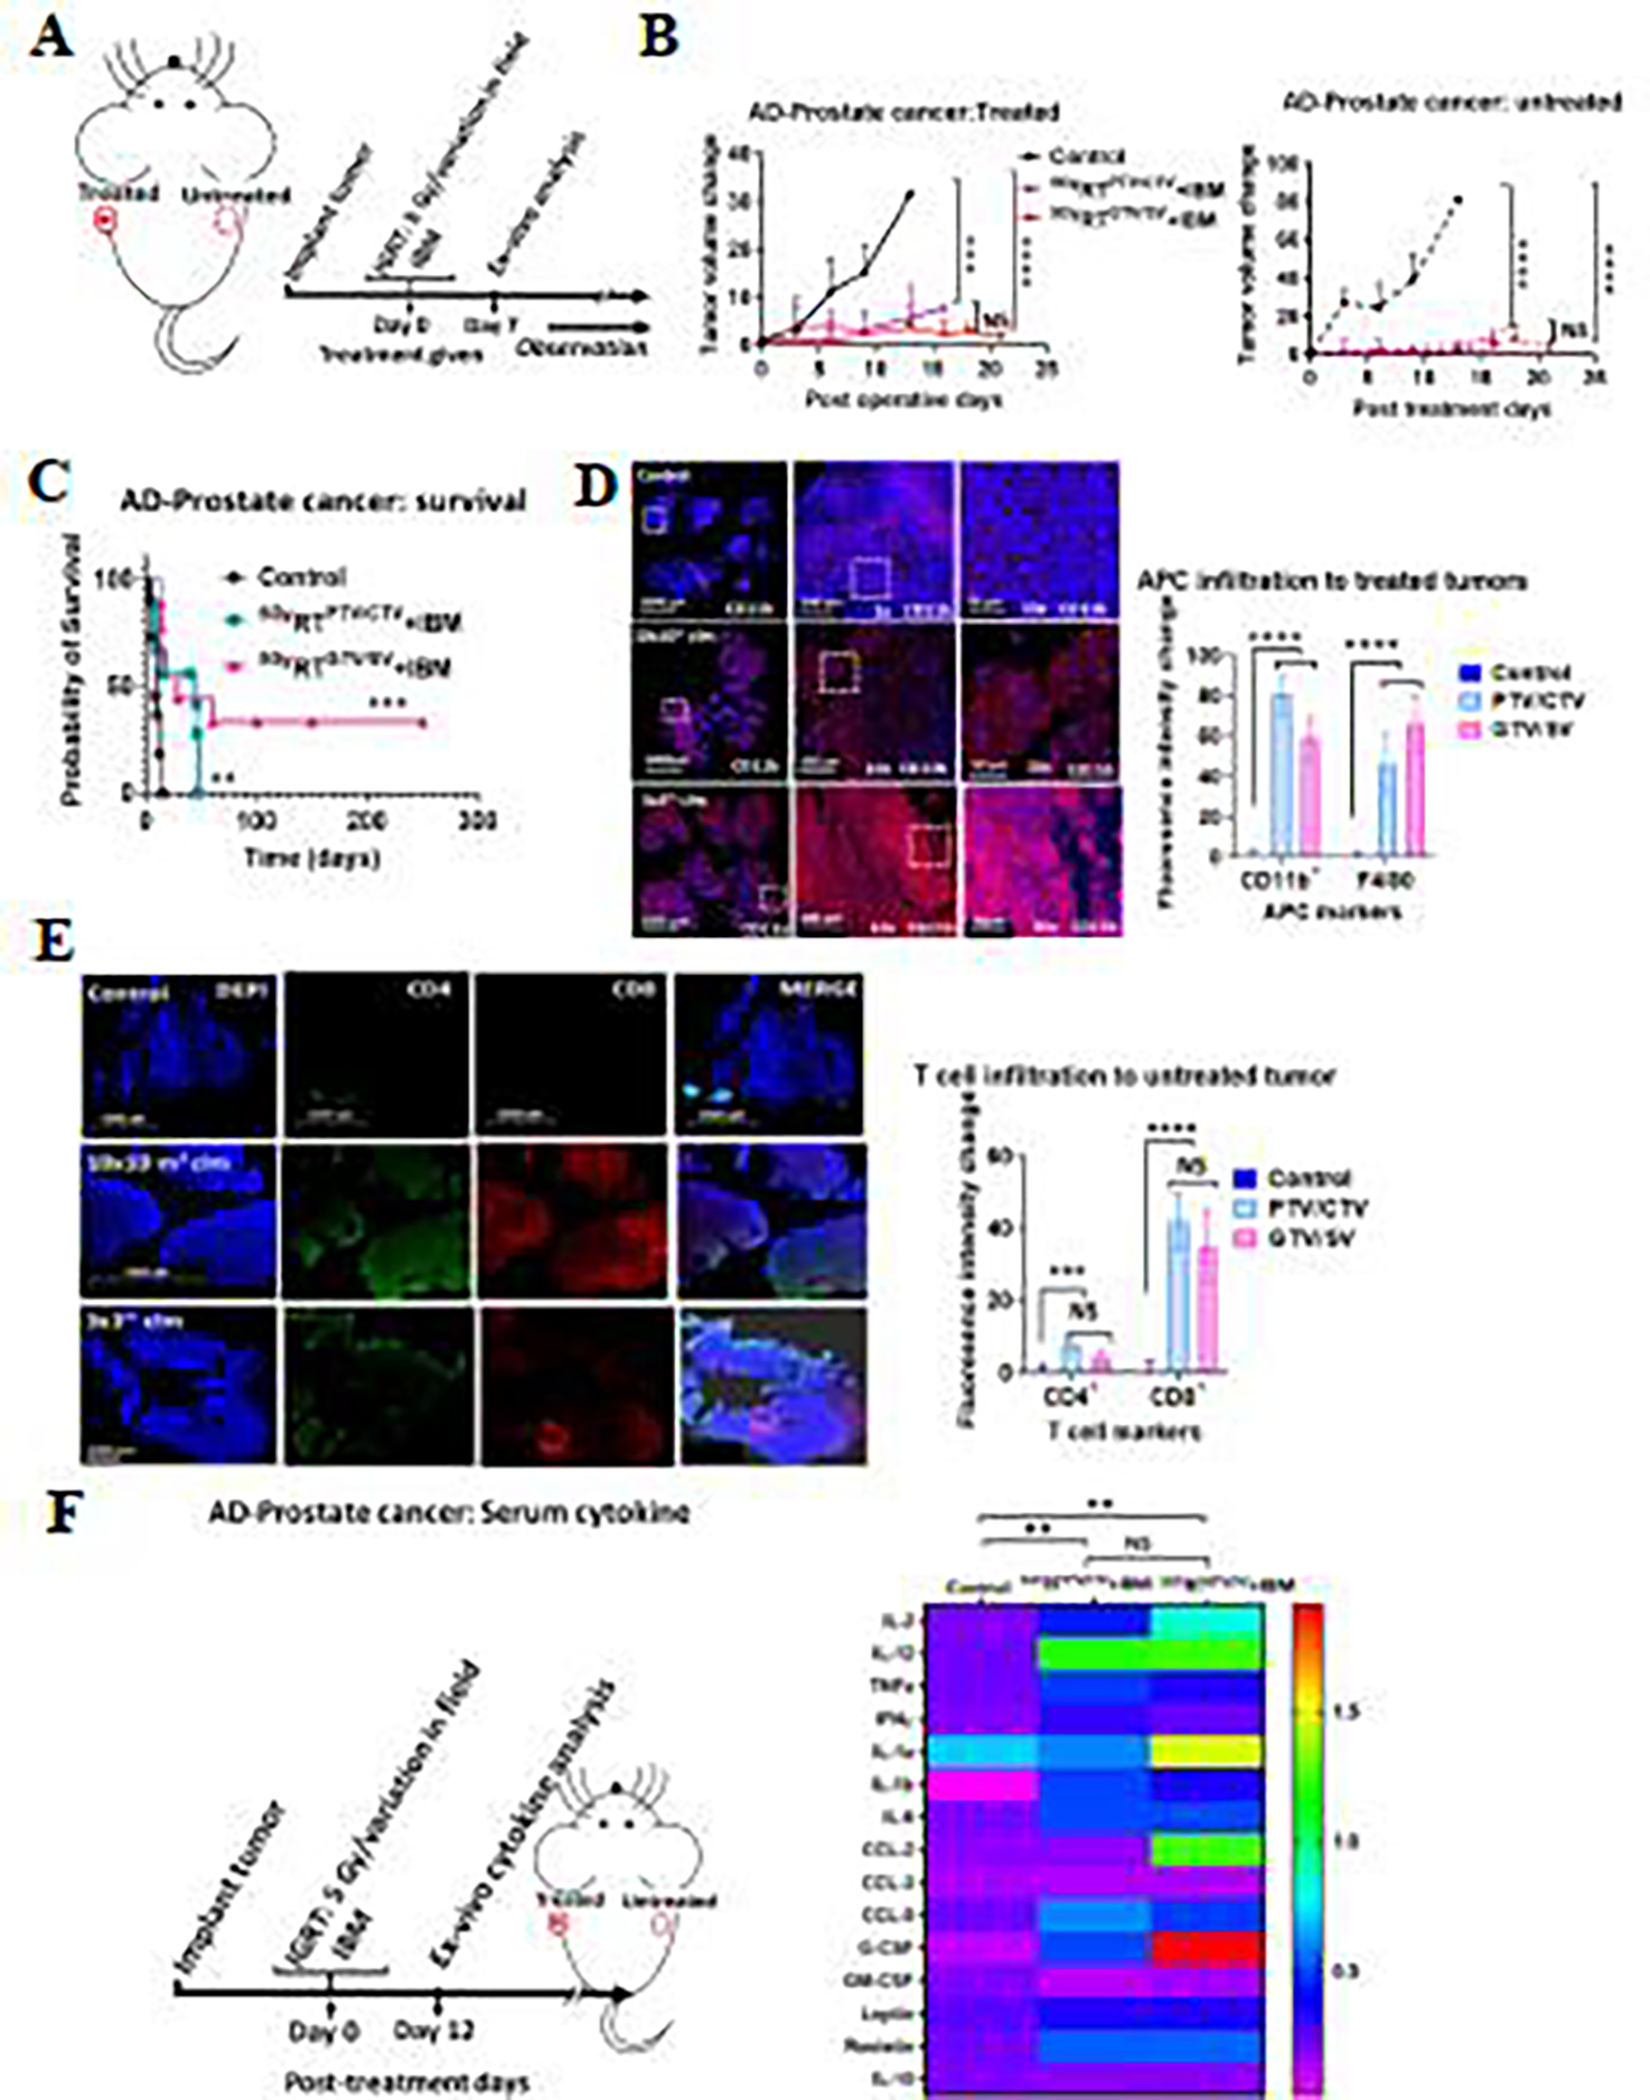
Fig. 4.

Treatment with different field sizes in a castration resistant prostate cancer/AD-prostate cancer model. (A) Treatment design. (B) Comparing tumor volume change in both treated (p<0.001, p<0.0001) and untreated (p<0.0001, 0.0001) AD-prostate cancers in SQ model, where 5 Gy of IGRT with IBM (5GyRT+IBM) was given in one of the implanted tumors compared with control cohorts. IGRT was delivered using 10×10 mm2 collimators (cohort 5GyRTPTV/CTV+IBM, n=5), or 3×3 mm2 collimators (cohort 5GyRTGTV/SV+IBM, n=5 for each cohort); Here AD-TRAMP-C1 cells were implanted subcutaneously in two contralateral flanks. (C) A Kaplan-Meier survival curve for AD-prostate cancer orthotopic model, n=9 (p <0.01 for 10×10 mm2 and p<0.001 in 3×3 mm2 field sizes for RT). (D) Representative images showing the infiltration of APCs like dendritic cells, DCs, (CD11b+) to the treated tumors (SQ) on day 7 post treatment comparing different field sizes for treatment. Ex-vivo treated tumors were resected. Paraffin embedded 4 mm thin sections were treated with CD11b+ antibody for IF analysis. Bar graph is the quantified representation of both DCs (p<0001) and macrophages (p<0.0001) infiltration in treated tumor microenvironment. The y-axis showing the average integrated fluorescent intensity change for different cohorts (n=3). (E) Seven-day post-treatment comparison of CD4+ (p<0.001) and CD8+ (p<0.0001) T-cell infiltration into untreated tumors (orthotopic) shown in representative images and in a bar graph. In all cases, green color represents FITC (excitation wavelength 480 nm) for CD4+ and red color represents CY3 for CD8+ T lymphocyte infiltration. DAPI (blue) represents for nucleus staining of the tumor tissue. Data represents the mean +/− SD. (F) Research design and a heatmap showing the OD values (at 490 nm) of serum pro- and anti-inflammatory cytokines. Mouse Cytokine ELISA assay was performed on serum collected from mice treated with combination of RT+IBM where 5 Gy of RT was delivered in one fraction for 10×10 mm2 or 3×3 mm2 sized fields (5GyRTPTV/CTV+IBM vs. 5GyRTGTV/SV+IBM respectively) to one of the tumors (treated tumor), (n=5). Day twelve post-treatment serum cytokine was analyzed using an ELISA kit pretreated with antibody against the analyzed cytokines (Signosis, Inc.). ** p< 0.01, *** p< 0.001, **** p< 0.0001. NS abbreviates not significant.
