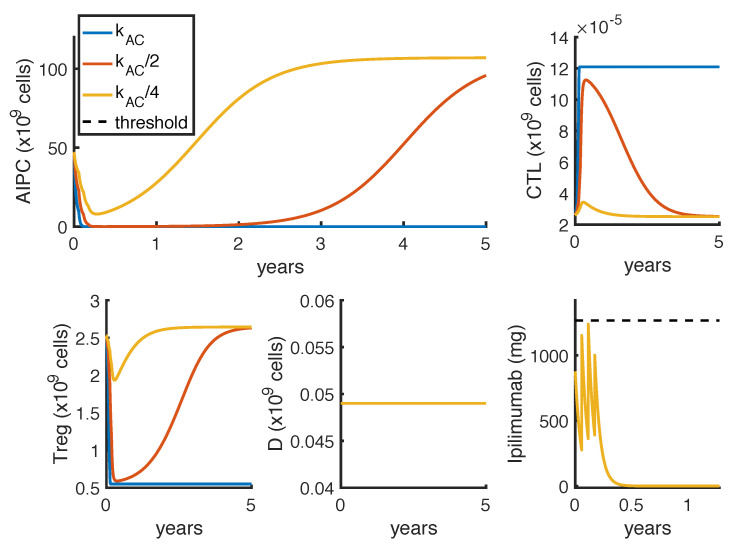
Figure 7.
Graphical sensitivy analysis on the parameter , representing the maximal killing rate of tumor by CTL due to the drug ipilimumab. Blue, orange and yellow lines represent, respectively, the model dynamics by setting the value of as 5.44 (the original estimate), 2.72 () and 1.81 (). The ipilimumab threshold has been highlighted with a black dotted line.

