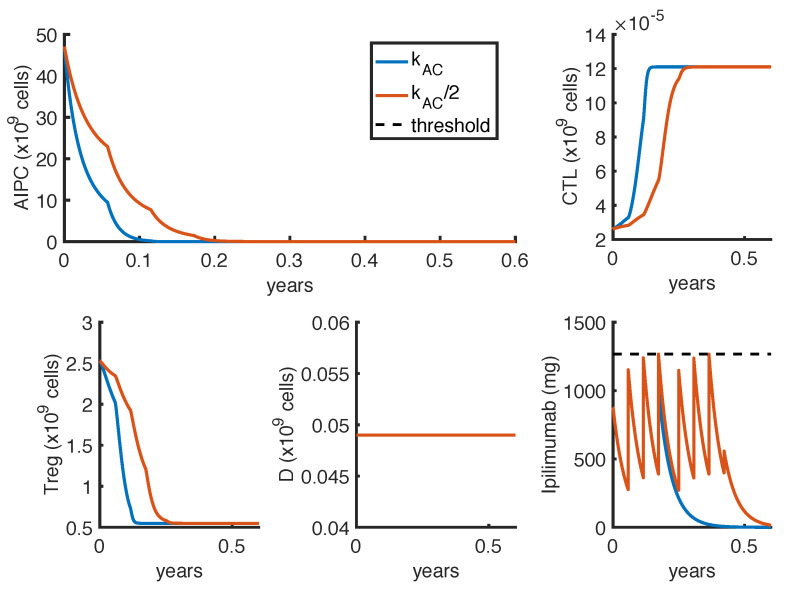
Figure A1.
Comparison between administration protocols obtained with different values of the parameter . The dynamics refer to the ipilimumab mono-therapy as result of the optimization problem OP2, with weeks. Blue lines represent the model outcomes with the estimate value of (the same presented in Figure 6, blue line), while orange lines represent the one with . The ipilimumab threshold has been highlighted with a black dotted line.

