Figure 2.
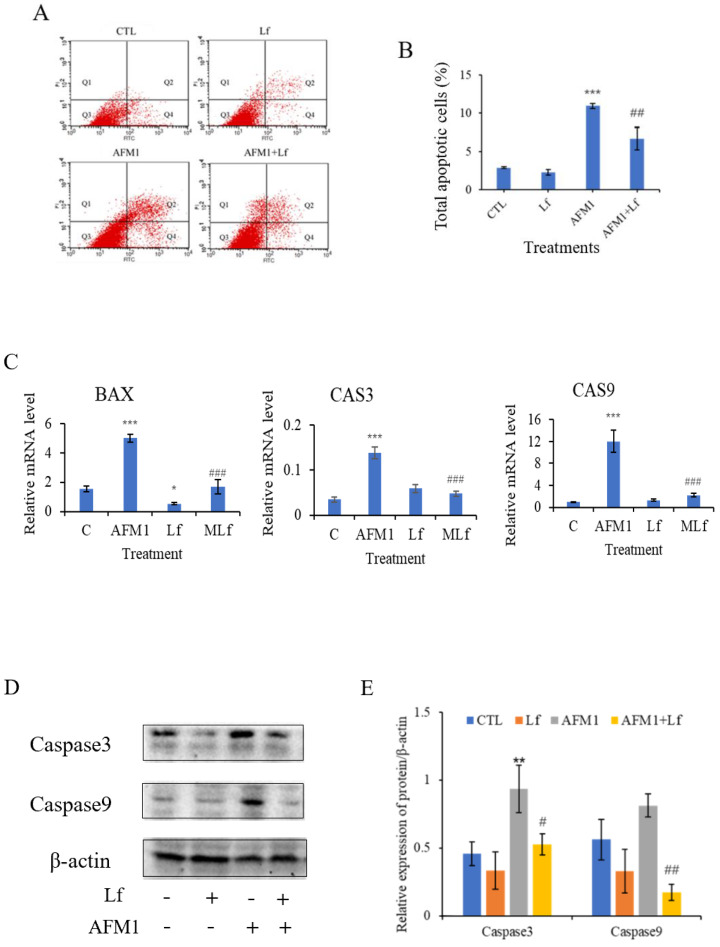
Lf ameliorated AFM1-induced apoptosis in NCM460 cells. The apoptosis rate of cells exposed to 8 μg/mL AFM1 with or without Lf of 100 μg/mL. (A) Flow cytometry plots of NCM460 cells. (B) The sum of the early and late apoptotic cell populations was the total apoptotic cells. (C) Relative mRNA levels of apoptosis genes. C represents control, MLf represents combined AFM1 and Lf. (D,E) Immunoblotting was performed on protein extracts for autophagy proteins and band densities quantification. Results represented as means ± SD. * p < 0.05, ** p < 0.01, *** p < 0.001 vs. control (C/CTL). # p < 0.05, ## p < 0.01, ### p < 0.001 vs. AFM1.

