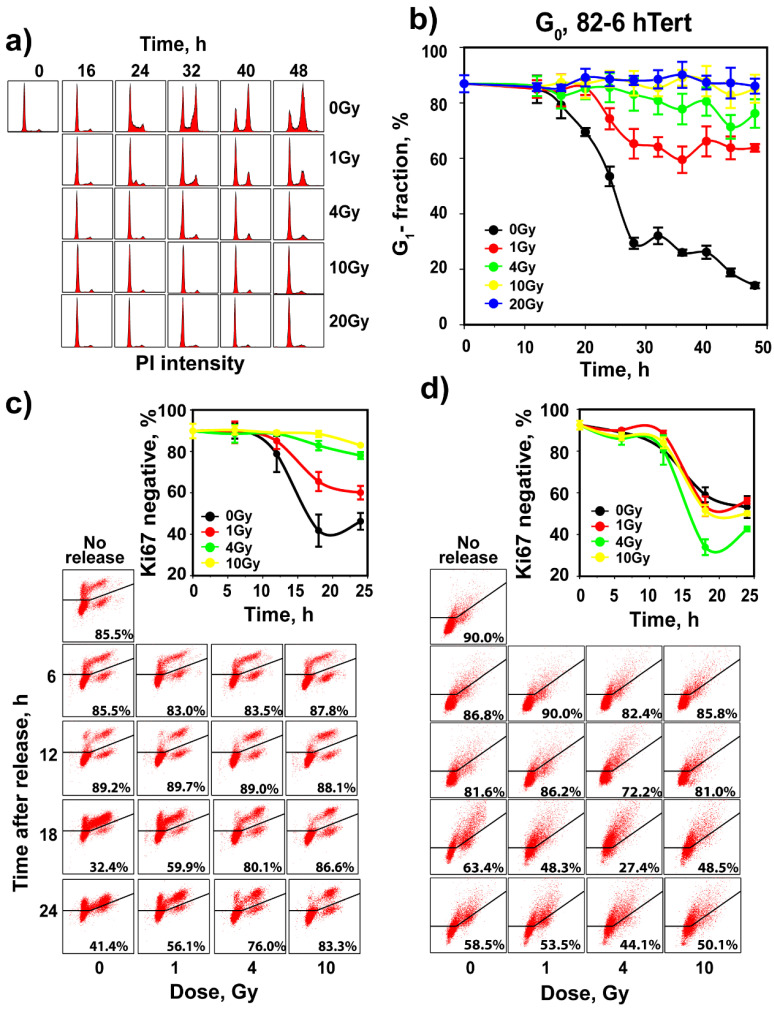
Figure 3.
Assessment of G1 checkpoint in irradiated G0 cells of SD 82-6 hTert cell cultures. (a) Histograms showing cell cycle distribution as a function of time after exposure to different doses of X-rays. Cells are transferred to complete growth medium supplemented with nocodazole just before irradiation. Owing to the addition of nocodazole in the growth medium, cell cycle progression causes a progressive enrichment in cells with G2/M DNA content. The reduction in the fraction of cells with G0/G1 content as a function of time reflects the progression of G0 cells into the S phase. Here again, the reduction in this rate reflects the activation of G1 checkpoint. (b) As in Figure 1b for SD, 82-6 hTert cells exposed to the indicated doses of IR. (c) Analysis of Ki67 in the cell cultures analyzed in (b). (d) Analysis of pyronin Y in the cell cultures analyzed in (b). Plotted is the mean and SE from three independent experiments. See also Table S2 for more information.

