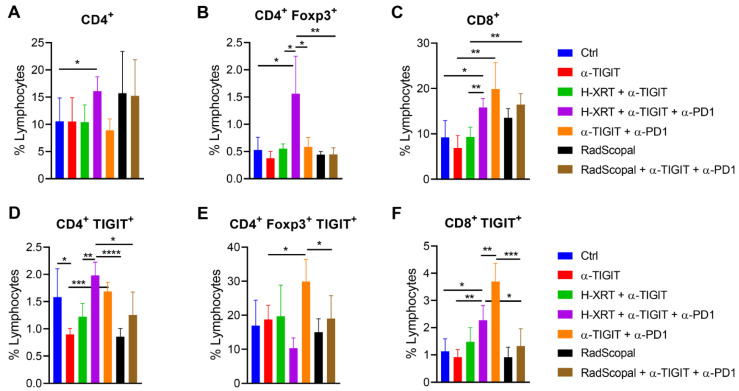
Figure 4.
RadScopal treatment reduced TIGIT-expressing T-cell populations. (A–F) The RadScopal model was established as in Figure 2A. On Day 20, secondary tumors were harvested and processed for flow cytometric analysis. (A–C) Cells were first gated on lymphocytes, followed by CD45, and then on CD4 vs. CD8, or CD4+ Foxp3+ Tregs. (D,F) Cells were gated on lymphocytes, then CD45, then on either CD4+ TIGIT+ or CD8+ TIGIT+ populations. (E) Cells were gated on lymphocytes, then CD45, then CD4+ Foxp3+ Tregs, then TIGIT+ Tregs. Student t-tests were used to compare the statistical significance between two groups with p ≤ 0.05 considered significant. * p ≤ 0.05, ** p ≤ 0.01, *** p ≤ 0.001, **** p ≤ 0.0001.

