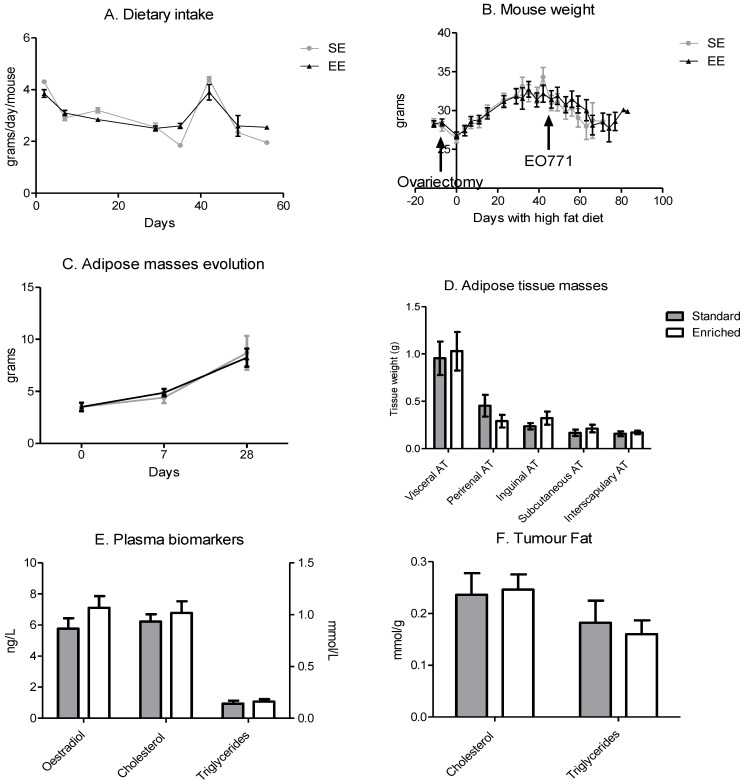
Figure 3.
Dietary intakes are equivalent, and the high-fat diet induces an adipose mass gain. (A) Dietary intake per day per mouse, results are in grams per day per mouse. (means of 10 mice/group/days) (B) Mouse weight during experimentation. Day 0 corresponds to the beginning of the high-fat diet. The surgeries are indicated by an arrow on the graph. Results are in grams. (means of 10 mice/group/days) (C) Time course of adipose masses per mouse analysed by EchoMRI. (means of 10 mice/group/days) (D) adipose tissue masses at sacrifice in grams (means of 10 mice/group) (E) Quantity of oestradiol, cholesterol and triglycerides. (n = 5 mice plasma samples/group) (F) Quantity of cholesterol and triglycerides. (n = 5 mice tumour samples/group). Data are mean ± SEM. Data were analysed by ANOVA repeated measures.

