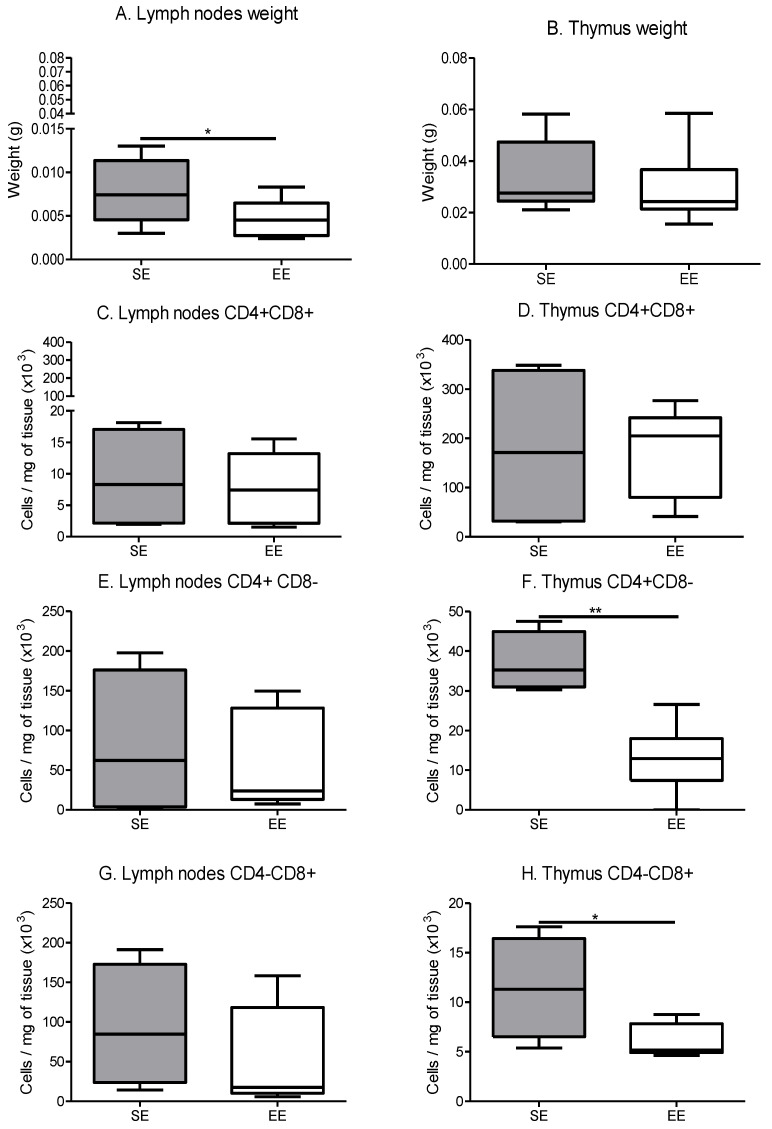
Figure 9.
Immune lymphocytes maturation in secondary immune organs. (A) Lymph node weight depending on the environment, results are grams. (n = 10 mice/group) (B) Thymus weight depending on the environment, results are grams. (n = 10 mice/group) (C) Lymph node CD4+ CD8+ maturation, results are in cells per mg of tissue. (D) Thymus CD4+ CD8+ maturation, results are in cells per mg of tissue. (E) Lymph node CD4+ CD8− maturation, results are in cells per mg of tissue. (F) Thymus CD4+ CD8− maturation, results are in cells per mg of tissue. (G) Lymph node CD4− CD8+ maturation, results are in cells per mg of tissue (H) Thymus CD4− CD8+ maturation, results are in cells per mg of tissue. Phenotyping is performed on 5 mice tissue/group. Data are expressed as mean ± SEM. Data were analysed by Mann–Whitney t-test. Representative data are shown: * p ˂ 0.05, ** p < 0.01, SE vs. EE.

