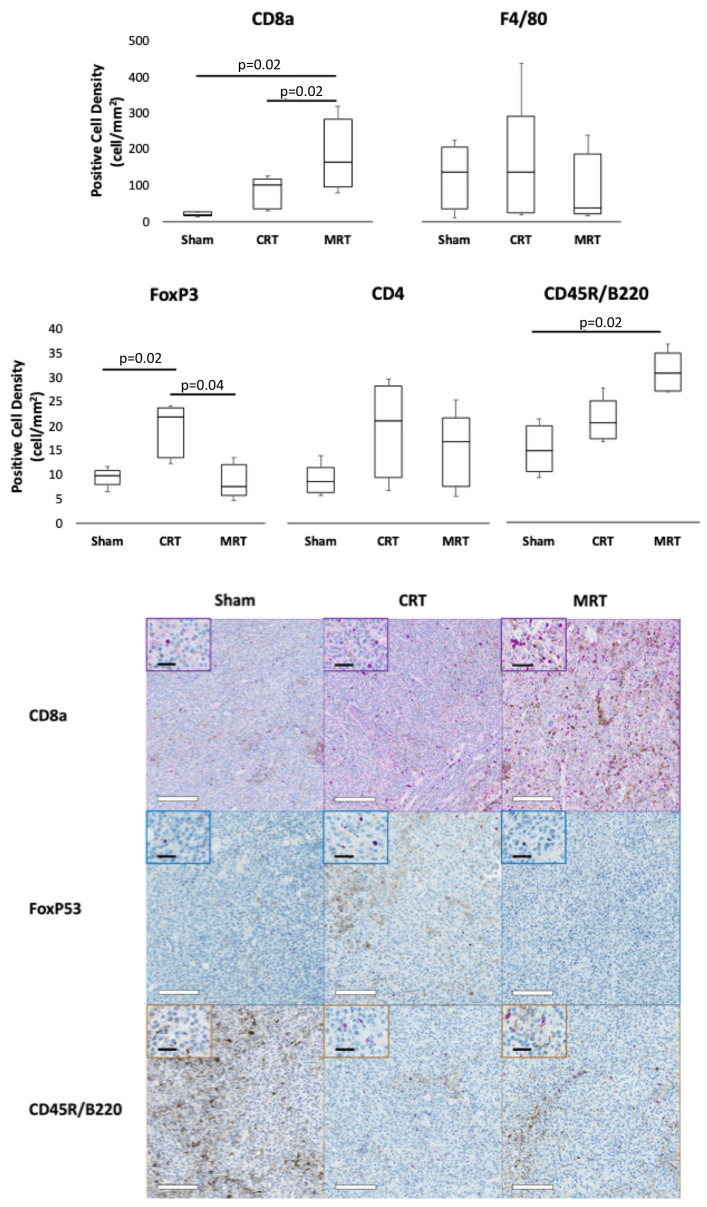
Figure 4.
Immunohistology analysis. The box-whisker plots demonstrate the number of different immune cells in tumor tissue; p-values are derived using the Dwass–Steel–Critchlow–Fligner method. The tumor histology sections were stained for CD8a, FoxP53 and CD45R. White bars = 200 μm; black bars = 50 μm. MRT = microplanar radiation therapy; CRT = conventional radiation therapy; CD8a = cytotoxic T cells; F4/80 = macrophages; FoxP53 = Tregs; CD4 = helper T cells; CD54R/B220 = B cells.

