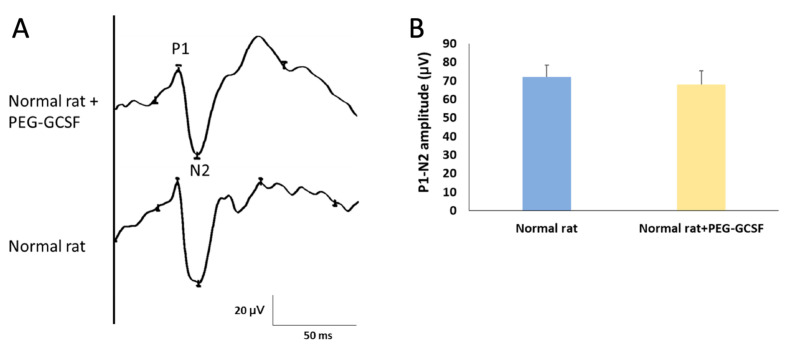
Figure 2.
Evaluation of the visual function by using flash visual evoked potentials (fVEPs) in normal rats with or without intravitreal injection (IVI) of pegylated granulocyte colony-stimulating factor (PEG-G-CSF). (A) Representative fVEP tracings in the rats treated with or without IVI of PEG-GCSF 14 days later. (B) Bar charts demonstrate the P1-N2 amplitude. The values of amplitude are expressed as mean ± standard deviation (SD) in each group (n = 6 in each group). There was no significant difference in the amplitudes of the P1-N2 waves between the rats treated and not treated with IVI of PEG-G-CSF. P1, the first positive peak; N2, the second negative peak.

