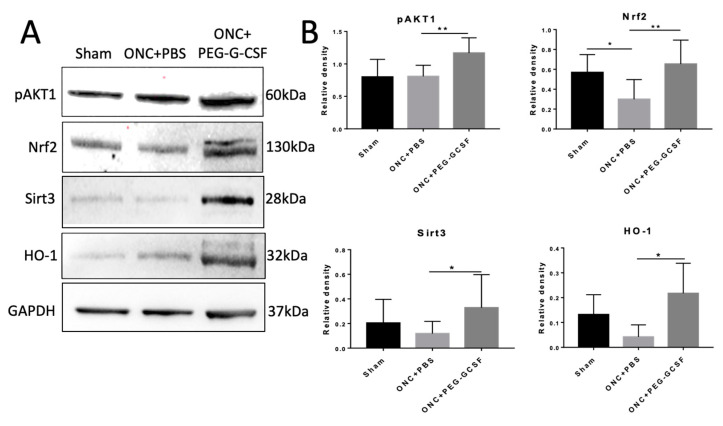
Figure 8.
Western blot analyses in the samples of rat optic nerve (ON) post different operations. (A) Representative photograph of the immunoblotting of the expression of p-Akt1, Nrf2, Sirt3, and HO-1 in the ON samples. (B) Quantification of the protein bands of p-Akt1, Nrf2, Sirt3, and HO-1. Each value was measured by using iBright imaging software and normalized to GAPDH. The expressions of p-Akt1, Nrf2, Sirt3, and HO-1 were significantly higher in the PEG-G-CSF-treated crushed samples than those in the sham group or the PBS-treated crushed samples. Data are expressed as mean ± standard deviation (SD) in each group (n = 6 in each group). *: p < 0.05. **: p < 0.01.

