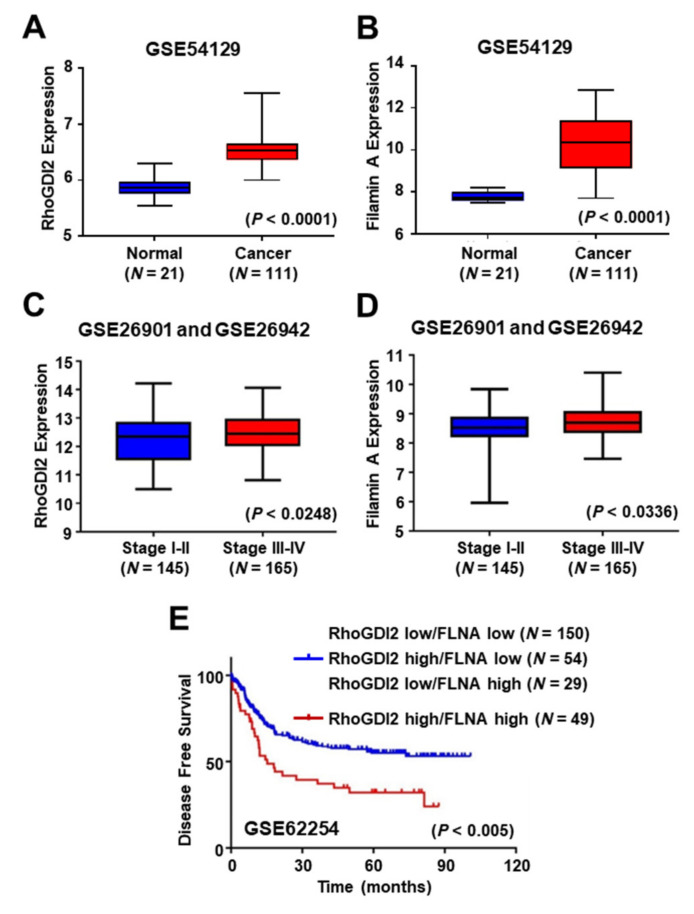
Figure 5.
Expression of RhoGDI2 and Filamin A could be poor prognostic markers in gastric cancer patients. (A,B) Comparison of RhoGDI2 (A) and Filamin A (B) expression levels between normal and gastric cancer patient tissues from the GEO data set (GSE54129). The interquartile range is shown by the boxes, the median is represented by the center, and the whiskers represent the minimum and maximum values. The unpaired, two-tailed Student’s t-test was used to calculate p-values. (C,D) Comparison of RhoGDI2 (C) and Filamin A (D) expression levels in different stages of gastric cancer patients from GEO data sets (GSE26901 and GSE26942). The interquartile range is shown by the boxes, the median is represented by the center, and the whiskers represent the minimum and maximum values. The unpaired, two-tailed Student’s t-test was used to calculate p-values. (E) Correlation of RhoGDI2 and Filamin A expression levels with disease free survival in 282 gastric cancer patients using a publicly available microarray data set (GSE62254). A Kaplan–Meier plot analysis showed disease free survival depending on the expression level of both RhoGDI2 and Filamin A. A log-rank test was used to calculate p-values.

