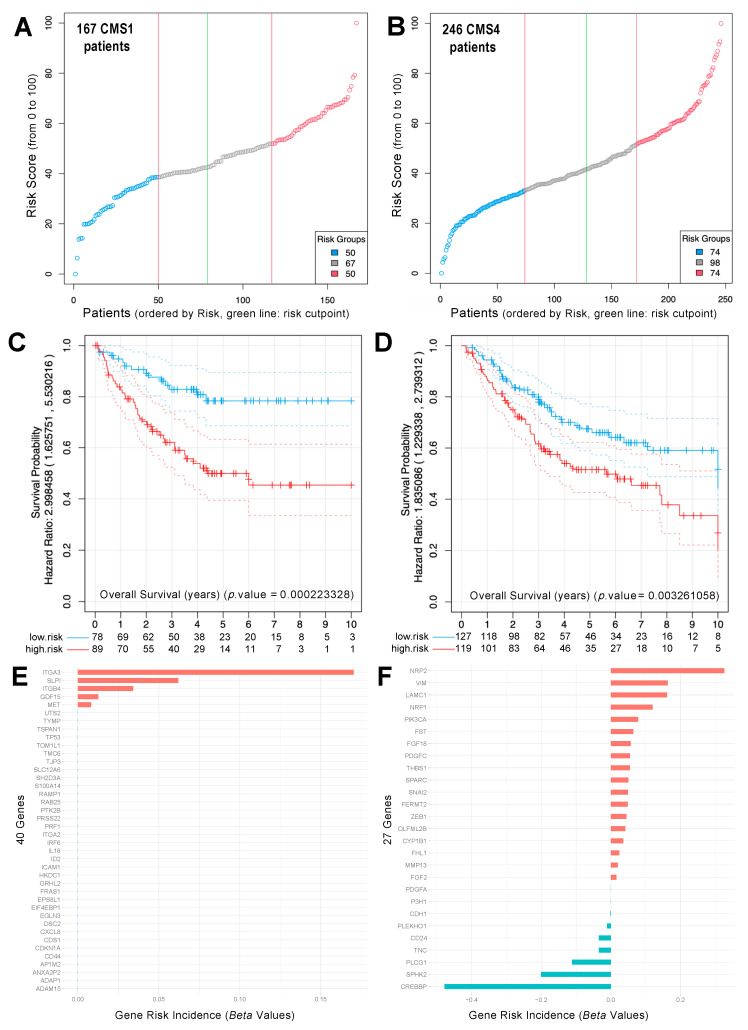
Figure 5.
Risk prediction of CRC tumor samples using the gene signature of 67 genes (40+27) identified in p21 depleted cells. A relative value-of-risk score (from 1 to 100%) was assigned to each patient included (A) in the CRC tumor samples classified as CMS1 (167 samples) using the signature of 40 genes that are upregulated in the cells with p21; or (B) in the CRC tumor samples classified as CMS4 (246 samples), using the 27 genes that are upregulated in the cells that do not have p21. Once each patient’s risk was calculated, a Kaplan–Meier analysis tested the separation of the two groups according to the survival: a high-risk group of individuals with poor survival (in red), and a low-risk group of individuals with good survival plotted (in blue). The p-value of the log-rank test, to evaluate the difference between the Kaplan–Meier curves of these two groups of patients for each gene signature, is presented in plots (C,D). Finally, two plots with the gene risk incidence scores (i.e., the beta values) of the genes tested in the risk prediction of the CMS1 samples (E) and the CMS4 samples (F) are presented.

