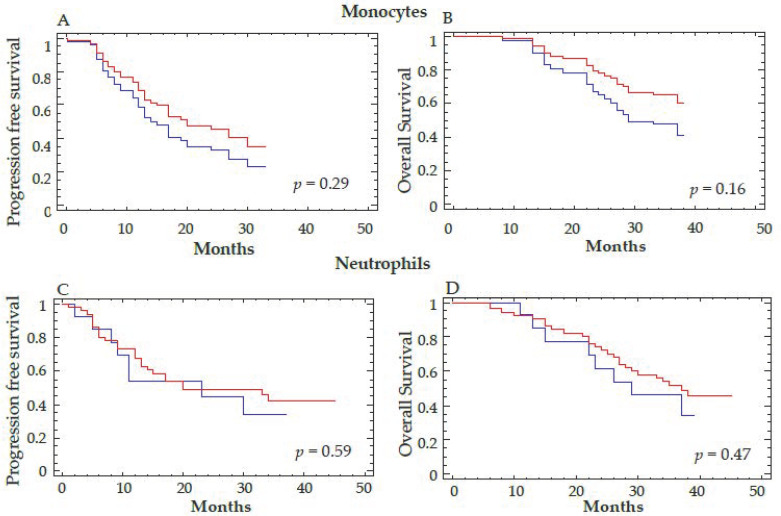
Figure 6.
Correlation between the decrease in total monocytes and neutrophils and clinical outcome. The total number of monocytes (A,B) and neutrophils (C,D) were determined by automatic hematologic count before (T1) and at the end of anti-angiogenic therapy (T3). A cutoff of 20% for the percent decrease of monocytes and neutrophils was considered to separate the two groups of patients. Progression-free survival (A,C) and overall survival (B,D) are represented. Log-rank test was used for the statistical analysis. The red curve corresponds to a decrease in the total number of monocytes (A,B) or neutrophils (C,D) >20% and the blue curve to a decrease ≤20% for these 2 parameters between T3–T1.

