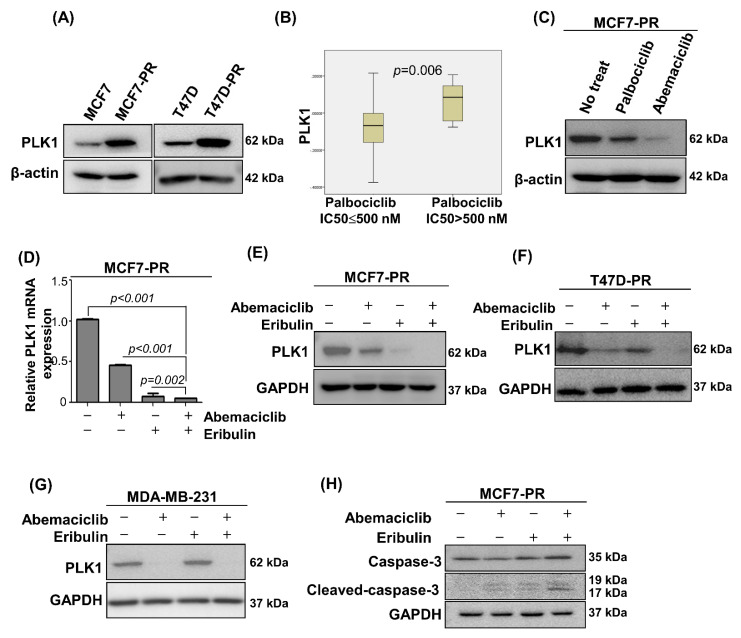
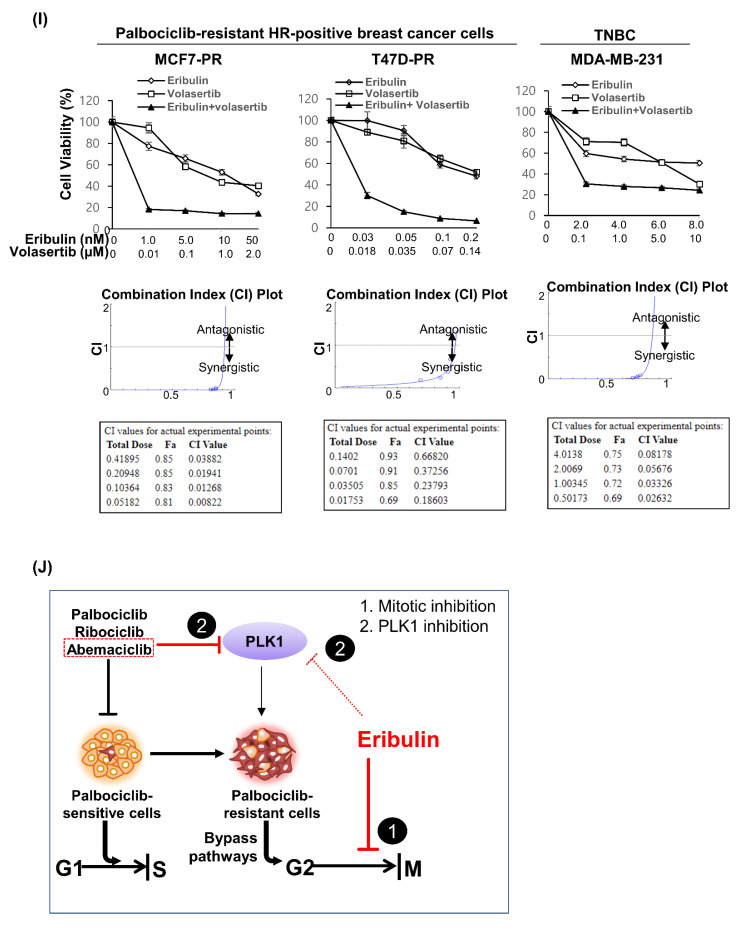
Figure 4.
Eribulin synergizes abemaciclib via PLK1 inhibition in the G2/M phase. (A) PLK1 expression in palbociclib-resistant cells compared with their sensitive counterparts was analyzed by western blot. (B) Correlation of CCLE, PLK1 gene and palbociclib sensitivity, which was defined as IC50 ≤ 500 nM in breast cancer cell lines. p-value was calculated by Student’s t-tests. (C) MCF7-PR cells were treated with IC50 concentration of palbociclib or abemaciclib for 48 h. PLK1 expression was analyzed by western blot. (D) Relative mRNA expression determined by qRT-PCR. PLK1 in MCF7-PR cells was downregulated with IC50 concentration of eribulin or abemaciclib and more downregulated with their sequential combination. p-values were calculated by Student’s t-test. Data are presented as mean ± standard deviation from three independent experiments. (E–H) Cells were treated with IC50 concentration of eribulin or abemaciclib and their combination for 48 h. (E–G) PLK1 expression and (H) cleaved caspase-3 expression was analyzed by western blot. (I) The viability of palbociclib-resistant HR-positive cells (MCF7-PR and T47D-PR) and TNBC (MDA-MB-231) cells after treatment with eribulin or volasertib at different concentrations for 48 h was assessed by MTT. IC50 values were calculated using CompuSyn. Data represent the mean ± standard deviation of four replicates. (J) Schematic diagram showing the mechanism of eribulin and abemaciclib inhibiting the escaped cells at the G2/M phase. Full length blots (A,C,E–H) are presented in Figure S5.


