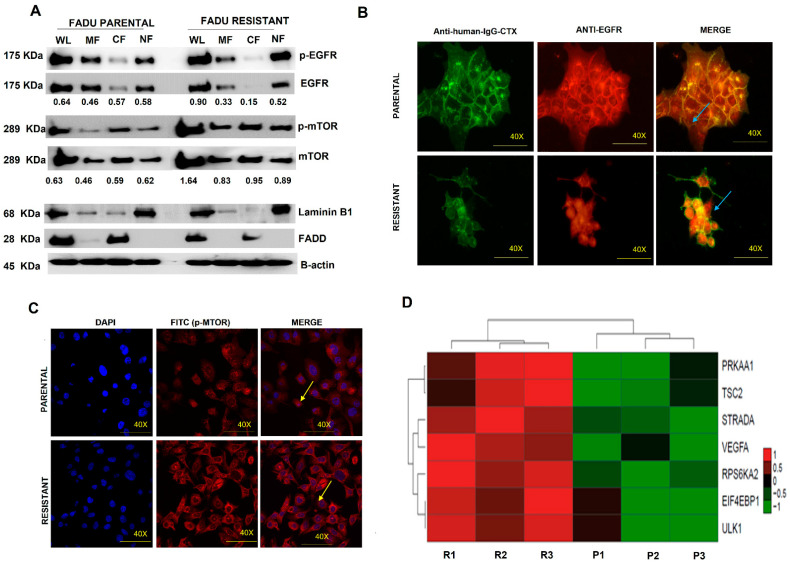
Figure 5.
EGFR-FITC+ internalization and mTOR-FITC+ expression in FaDu parental and FaDu resistant cells. (A) Subcellular protein fractionation assay for EGFR detection in parental and resistant cells. (B) p-EGFR nuclear translocation in resistant cells by Immunofluorescence assay. (C) p-mTOR immunofluorescence assay in parental and resistant cells. (D) mTOR-related genes differentially expressed in FaDu parental and FaDu resistant by microarray of expression. DAPI (Hoescht) staining in blue. p-EGFR-FITC+ p-mTOR-FITC+. Arrows indicate EGFR-FITC+ and p-mTOR-FITC+ localization. The images were acquired in 40× magnification. The number under the bands represented relative ratios (phospho/total).

