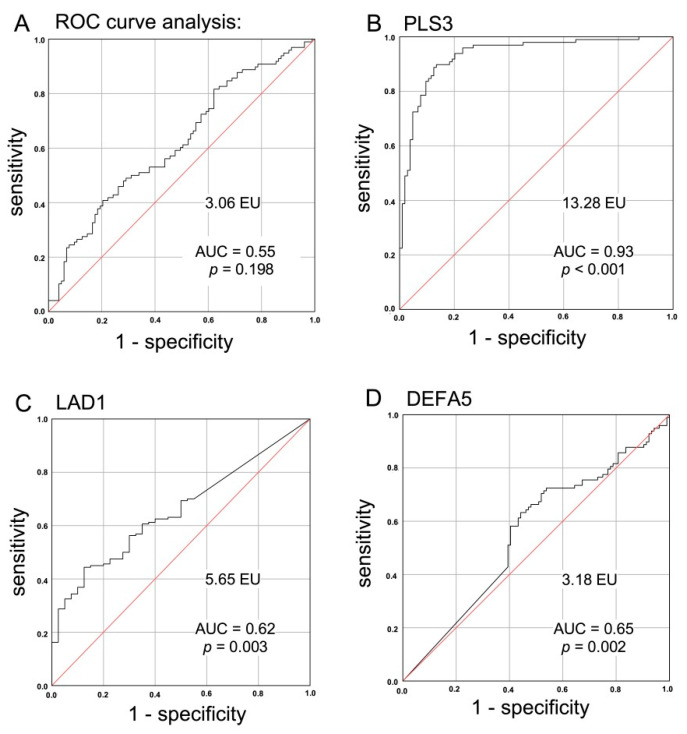
Figure 5.
ROC curve analysis of CTC-associated markers for validation of the suitability of either marker for discrimination of malignant and benign colorectal diseases. Expression levels of (A) CK20, (B) PLS3, (C) LAD1, and (D) DEFA5 in healthy controls, IID patients, and CRC patients were subjected to ROC curve analysis with respect to the discriminatory power between the variables “malignant disease” versus “benign disease” and “healthy”, respectively, with the exception of DEFA5, where the discriminatory categories were chosen to be “diseased” (CRC + IID) versus “healthy”. Using the ROC curve data, the Youden index J was calculated by the equation J = sensitivity + specificity—1 as the point with the best sensitivity and specificity, from which the specific cut-off values in [EU] were calculated that are mentioned in the figure. AUC = area under the curve.

