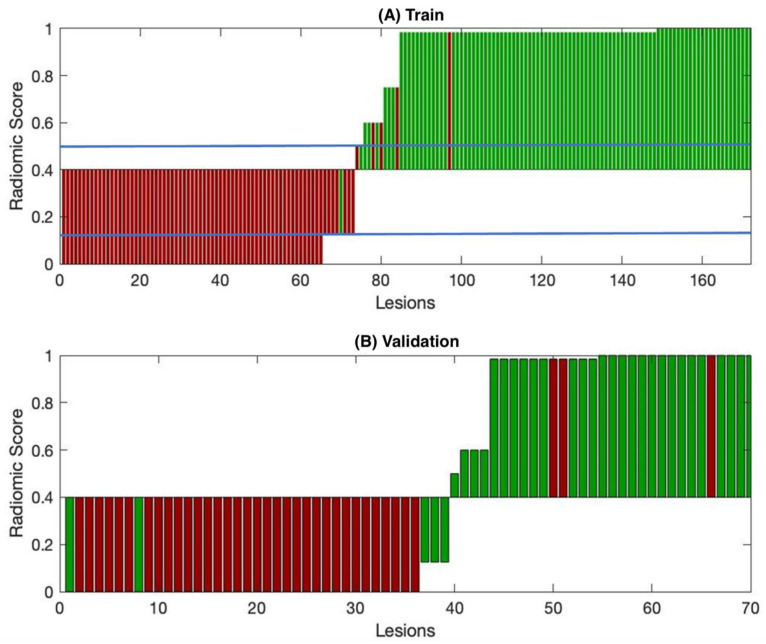
Figure 2.
Waterfall plot of lesions included in the training (A) and validation sets (B). The green marks indicate the responder lesions, while the red marks represent the nonresponder lesions. All errors in the validation set (8) are visible as miscolored bars. The y-axis represents the radiomics score produced by the decision tree. The radiomics optimized cutoff is 0.4. Blue lines show the range (0.125–0.5) in which the cutoff could be modified without changing the prediction.

