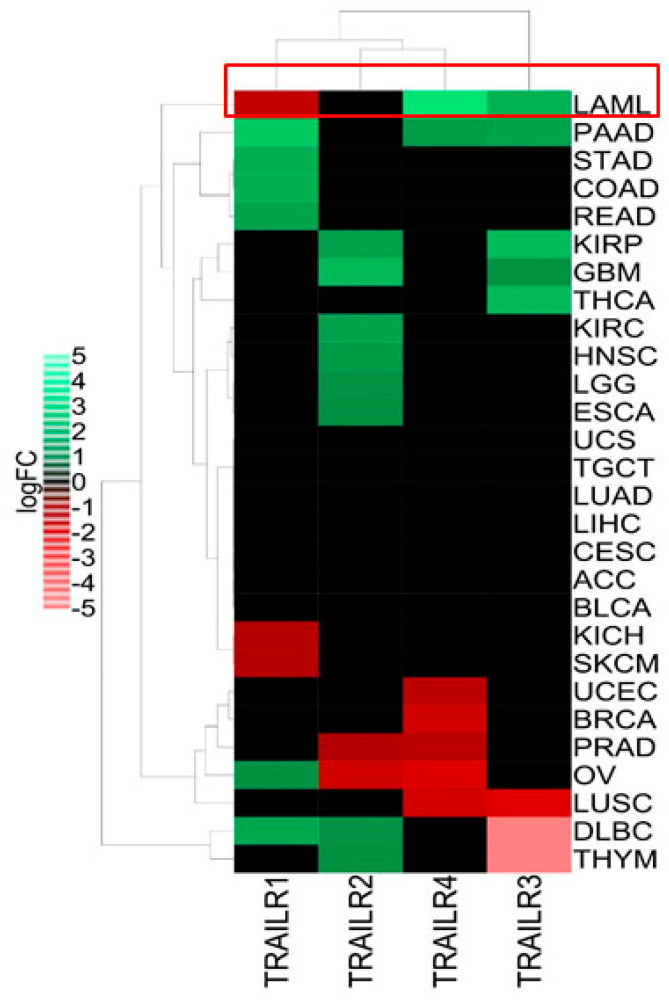
Figure 1.
TRAIL receptors expression pattern across 28 TCGA cancer types. The RNA sequencing data for 28 TCGA (The Cancer Genome Atlas) cancers as well as normal adjacent tumors and normal GTEx (Genotype-Tissue Expression) samples were extracted from Gene Expression Profiling Interactive Analysis 2 (GEPIA2). Then, the differential mRNA expression levels (log2 fold change (FC)) of four well-known TRAIL-R1 (DR4), TRAIL-R2 (DR5), TRAIL-R3 (DcR1) and TRAIL-R4 (DcR2) were analyzed in each cancer compared to their corresponding normal samples. The heatmap construction and clustering were performed as mentioned in Materials and Methods. Green and red colors represent significant (p-value < 0.01) upregulation (log2FC > 1) or downregulation (log2FC < 1) of TRAIL-Rs in different cancers, respectively. TCGA cancer groups include BLCA (bladder urothelial carcinoma), BRCA (breast invasive carcinoma), CESC (cervical squamous cell carcinoma and endocervical adenocarcinoma), CHOL (cholangiocarcinoma), ESCA (esophageal carcinoma), GBM (glioblastoma multiforme), HNSC (head and neck squamous cell carcinoma), KIRC (kidney renal clear cell carcinoma), KICH (kidney chromophobe), KIRP (kidney renal papillary cell carcinoma), LAML (acute myeloid leukemia), LIHC (liver hepatocellular carcinoma), LUAD (lung adenocarcinoma), LUSC (lung squamous cell carcinoma), PAAD (pancreatic adenocarcinoma), PCPG (pheochromocytoma and paraganglioma), PRAD (prostate adenocarcinoma), SARC (sarcoma), SKCM (skin cutaneous melanoma), STAD (stomach adenocarcinoma), THCA (thyroid carcinoma), THYM (thymoma), UCEC (uterine corpus endometrial carcinoma). Leukemia (LAML) has been highlighted in a red rectangle.

