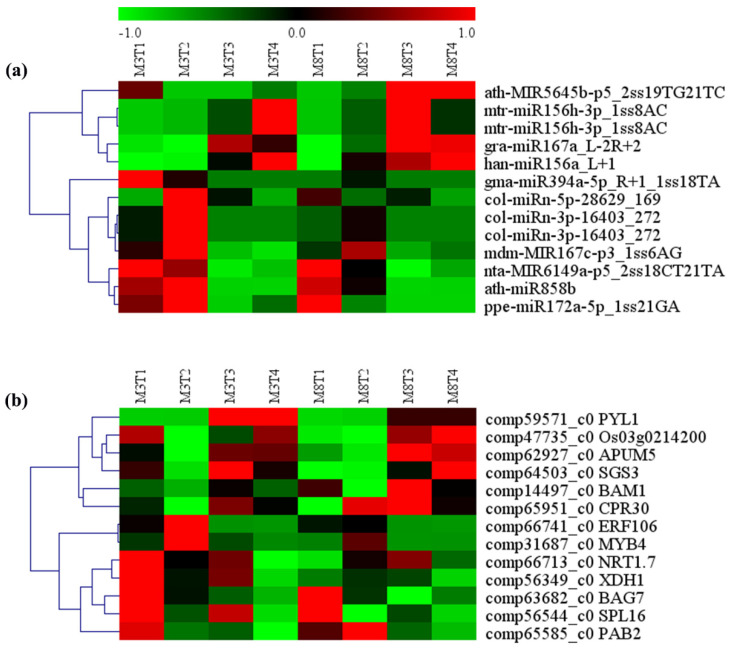
Figure 11.
Heat map analysis of (a) predicted differentially expressed miRNAs, and (b) their target genes, related to resistance, yield, and quality from the seeds of the ‘M3’ and ‘M8’ cultivars at four developmental stages. Red and green colors indicate high levels and low levels, respectively, of the miRNAs and their targets.

