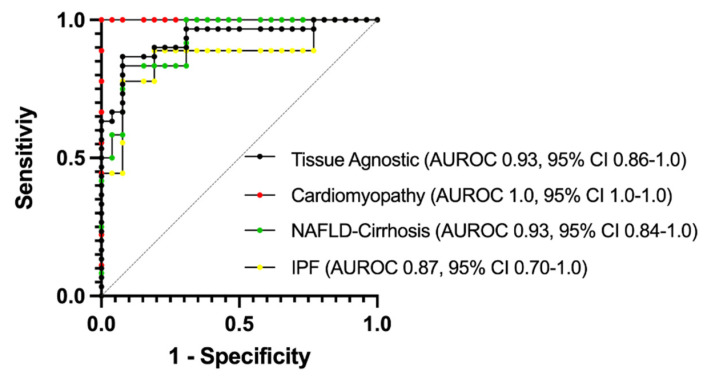
Figure 7.
AUROC analysis of plasma PNC for specificity and sensitivity. Normal donor samples (n= 26) were compared to samples from cardiomyopathy (Red, n = 9), NAFLD-Cirrhosis (Green, n = 12) and IPF (Yellow, n = 9) patients. To determine tissue-agnostic AUROC, all fibrotic samples were combined (Black, n= 30) and compared to normal donor samples. AUROC = area under the receiver operating characteristics curve.

