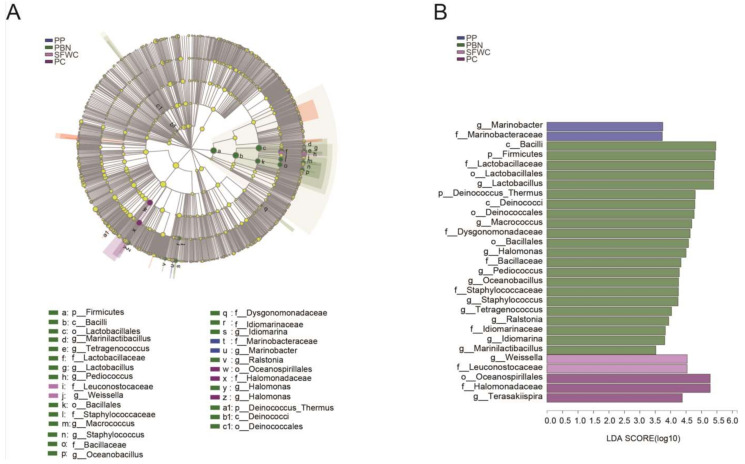
Figure 5.
LEfSe comparison of bacterial communities among four traditional fermented vegetables samples. (A) Cladogram representing the abundance of those taxa in these four fermented vegetables. (B) Histogram of the results of the microbiota in these four fermented vegetables with a threshold value of 2.

